
1/ LONG THREAD: Active Cases Data Can Mislead
Bonnie Henry thesis: School age cohorts are NOT contributors to community spread. Age groups 20-29 and 30-39 are the culprits.
(Assume data was accurately recorded & no padding with private tests, even though it may not be true.)
Bonnie Henry thesis: School age cohorts are NOT contributors to community spread. Age groups 20-29 and 30-39 are the culprits.
(Assume data was accurately recorded & no padding with private tests, even though it may not be true.)
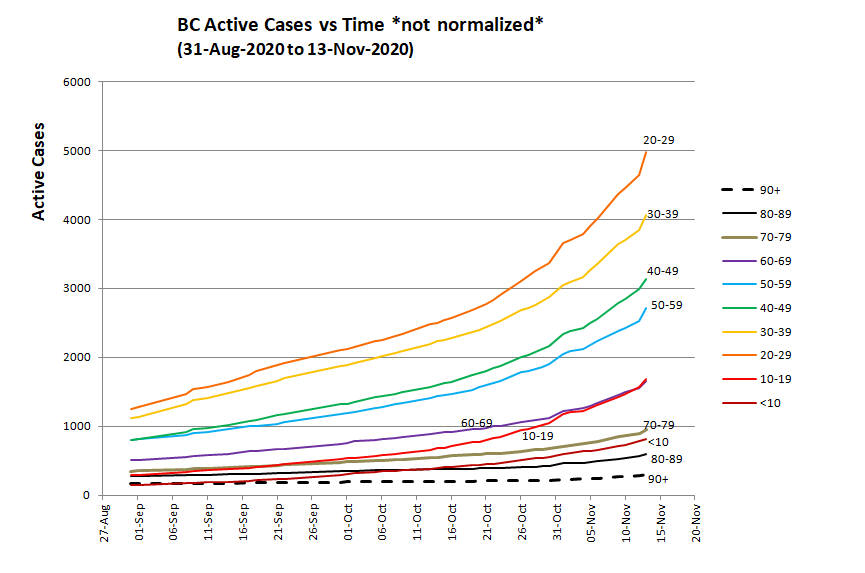
2/ The previous graph shows active cases for all age groups from Aug 31- Nov 13. No surprises here, all curves trend upwards, rising sharply for 20-29 yr and 30-39 yr adults. One might argue that these are the major spreaders due to high number of active cases. Is it really true?
3/ The normalized graph below adjusts for the fact that different age groups comprise a different percentage of the BC population. Active case data for each age group is scaled as if each group had exactly 100,000 people, to allow a valid comparison. The WHO uses this 100K base.
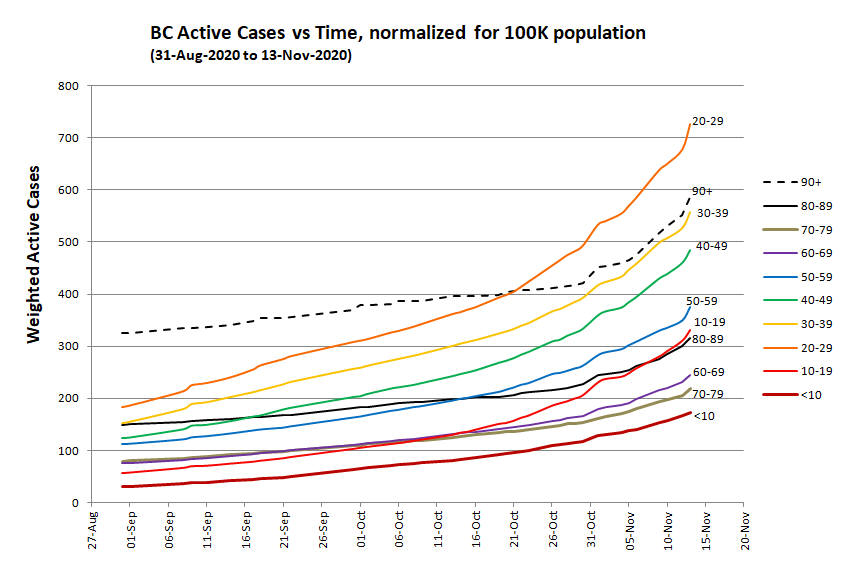
4/ With normalized data, *the graphs still show that the 20-29 & 30-39 groups have highest active cases per 100,000 people*. Notice the 90+ group (dashed black line) has moved to 3rd highest. The 10-19 & <10 groups remain below the middle of the pack. Was Bonnie Henry right?
5/ Refer to previous graphs: 2nd plotted w/ normalized data, both show same thing: 30-39 & 20-29 grps have highest active cases. The orange & yellow curves, judging by their steep rise at end, appear to have the highest rate of rise. But looks are deceiving for *rate of rise*.
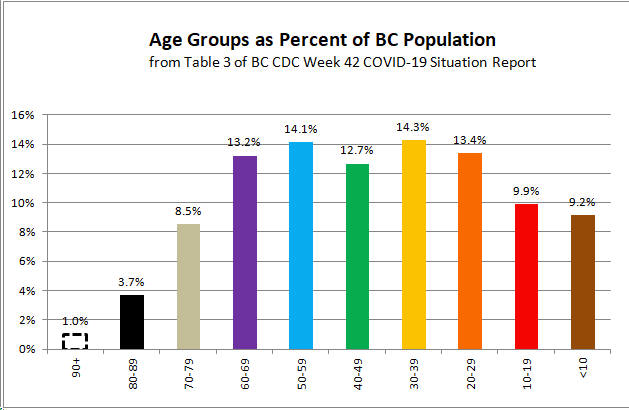
6/ Here's a distribution of all age groups as a % of the BC population. One can see that adults 20-29 and30-39 outnumber schools kids 10-19 and<10 yr. Its a very rough Gaussian distribution, or Bell Curve, for population. Does the same shape of Bell Curve apply for Active Cases?
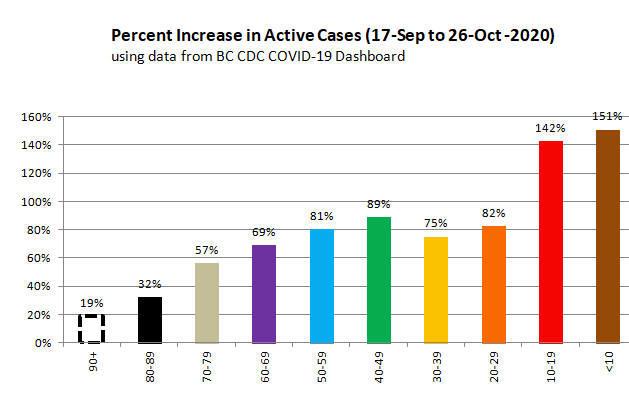
7/ No!!! The distribution of active cases doesn't have the same Bell shape as population distribution. The 10-19 and <10 age groups have a *higher* percentage of active cases as the 20-29 & 30-39 brackets. This % *rate of rise* holds both monthly & weekly as I posted on Oct 28.
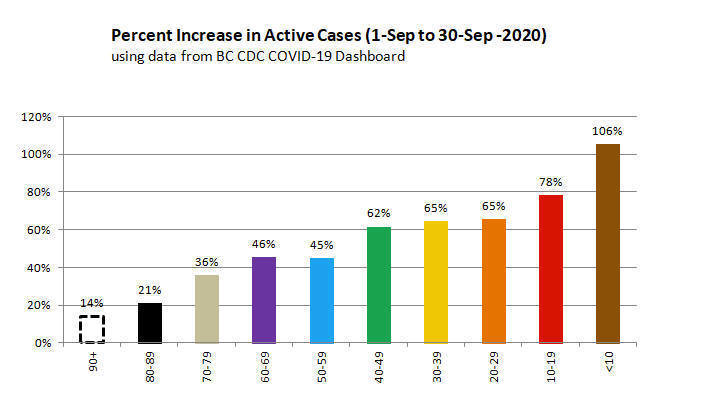
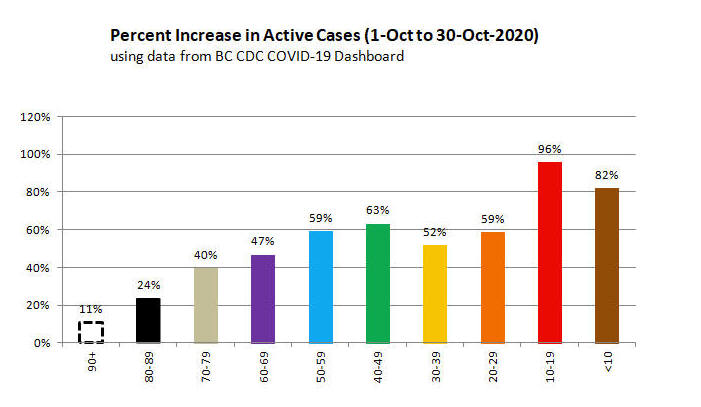
8/ Monthly charts for Sep and Oct. Weekly charts for Oct 9-16 and Oct 16-23. Even the daily chart for Sep 21-22 (not uploaded) started showing the highest % increases for *school ages* above all other groups.


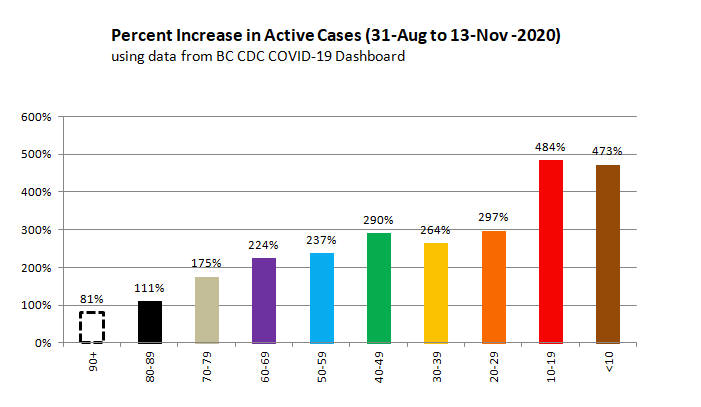
9/ Here's the full time span for which I have data. Unfortunately BC CDC doesn't seem to archive daily histograms (or at least I can't find them). The charts were mined from @realreporter's Twitter timeline😎. There are *huge* increases: 484% for 10-19 and 473% for <10 yr.
10/ Either Bonnie Henry's lying through her teeth about community transmission at schools, or kids are secretly skipping school, getting married w/ big wedding receptions, attending yoga/spin classes & drinking at karaoke bars. According to her, those are major avenues of spread.
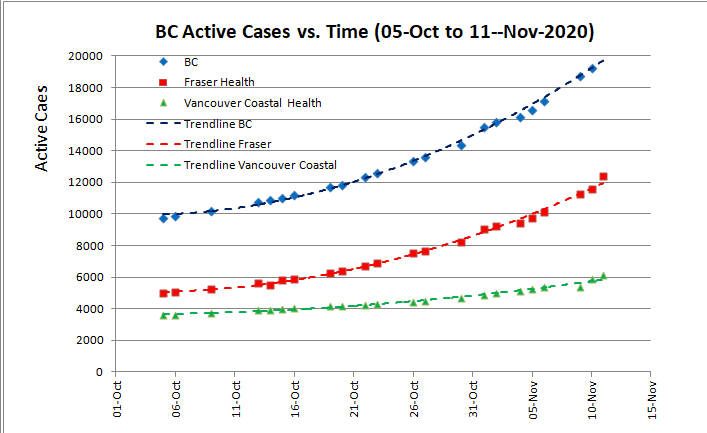
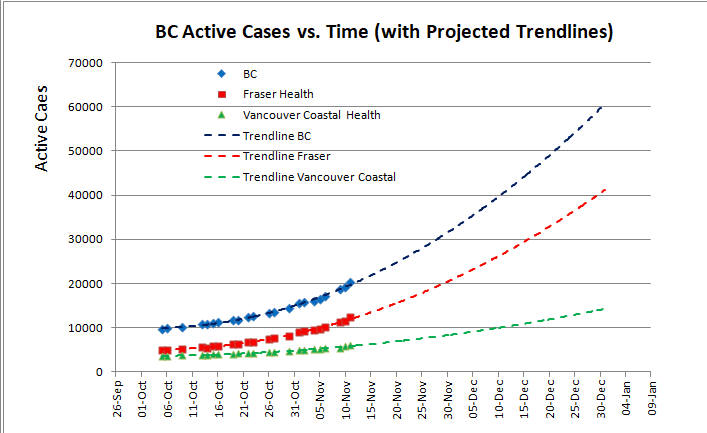
11/ On a final note, here are present curves plus projected curves to Dec 31 for BC, Fraser Health & Vancouver Coastal.
BC could reach 60,000 active cases by Dec 31. Let's see if our 2-week cool down period has any effect.
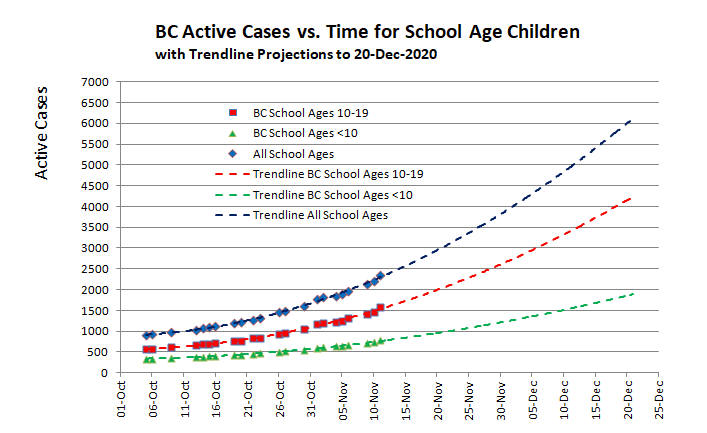
Last tweet is projected cases for school kids.
BC could reach 60,000 active cases by Dec 31. Let's see if our 2-week cool down period has any effect.
Last tweet is projected cases for school kids.
12/ BC schools could reach 6000 cases by mid Dec closing, with most coming from FH and VCH (4000+, 1500).
Some Christmas present from @jjhorgan @DrBonnieHenry @adriandix😠. At least "Santa has immunity".
#COVIDzero would make a nicer present.
Some Christmas present from @jjhorgan @DrBonnieHenry @adriandix😠. At least "Santa has immunity".
#COVIDzero would make a nicer present.
• • •
Missing some Tweet in this thread? You can try to
force a refresh


