(1/n) Excited to present collaborative work with @VirusesImmunity @fperrywilson, Yale Impact, @Mila_Quebec, @mrguywolf! We explore 54 million cells, 18 clinical variables from YNHH patients with Multiscale PHATE to find features predictive of outcome. biorxiv.org/content/10.110…
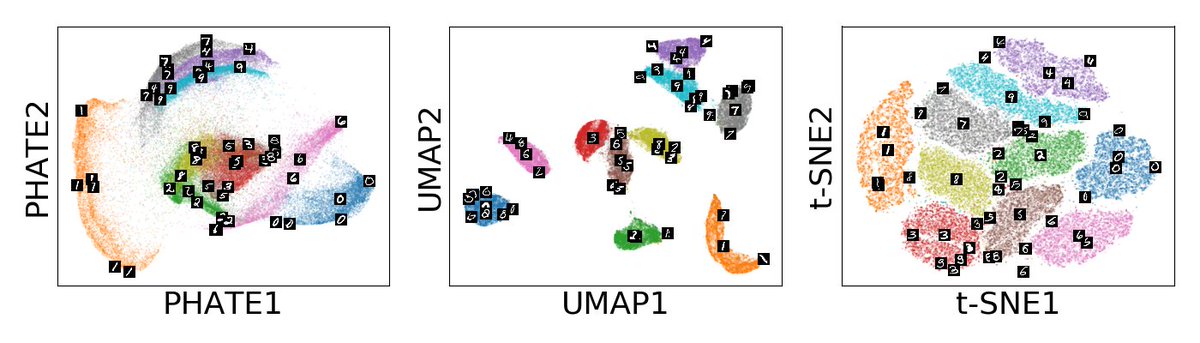
(2/n)If you like PHATE, you’ll love Multiscale PHATE which provides fast visualizations at multiple resolutions! Multiscale PHATE preserves manifold affinity and structure at each level of granularity. Kudos to first authors @mkuchroo @JcsHuang Patrick Wong. 

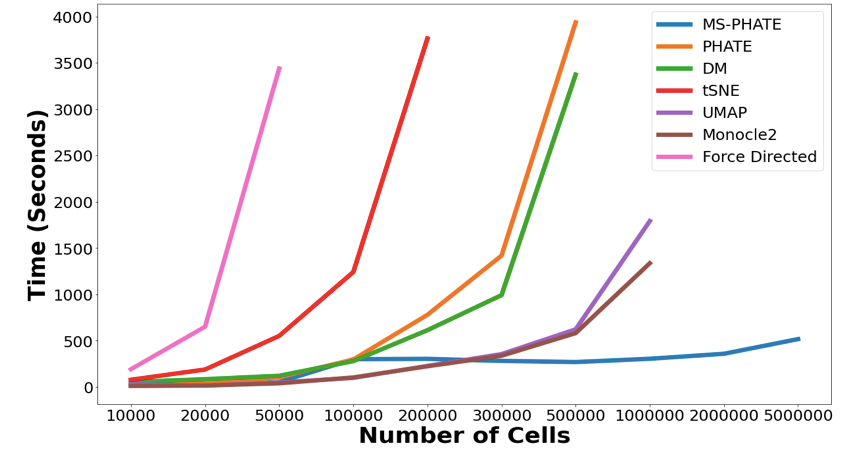
(3/n) Multiscale PHATE is far more scalable than other visualization techniques. We can embed 5 million cells in less than 10 minutes!
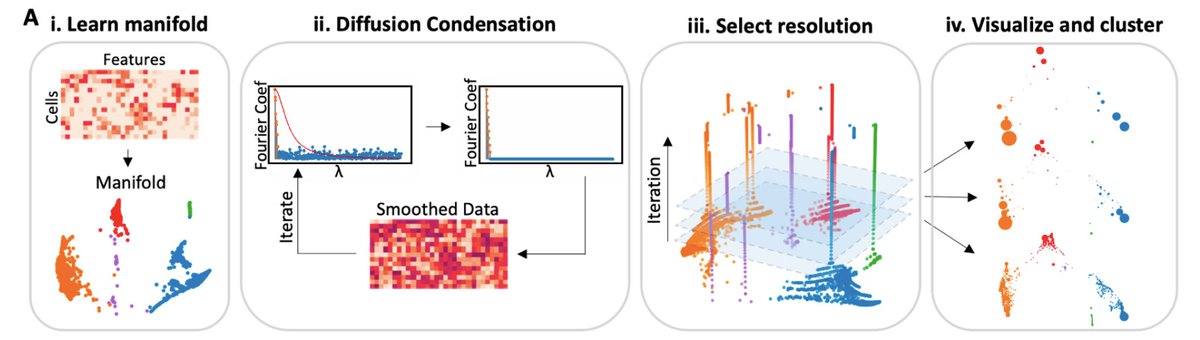
(4/n) Multiscale PHATE uses a powerful process called diffusion condensation that that slowly “condenses” datapoints onto their nearest neighbors, eventually merging points when they come close enough to create increasingly coarser grained views of the data.
(5/n) Multiscale PHATE uses diffusion condensation to sweep through different levels of granularity and selects specific levels of granularity as metastable resolutions for visualization and clustering.
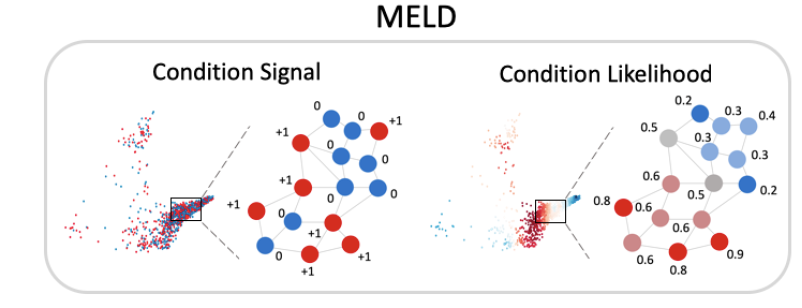
(6/n) For learning features predictive of disease we combine Multiscale PHATE with our MELD (biorxiv.org/content/10.110… ) method. MELD quantifies the likelihood that each cellular state occurs in a healthy individual vs diseased individual.
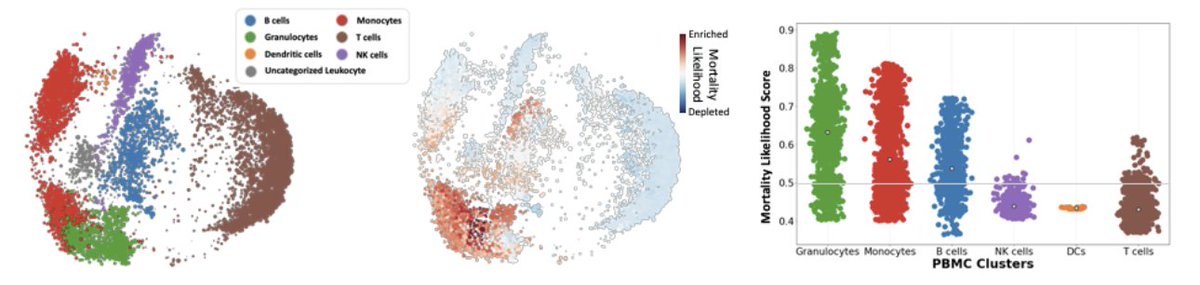
(7/n) We applied our approach to 54 millions cells measured by flow cytometry from 168 COVID-19 patients. We identified that granulocytes and monocytes were most enriched in patients that died from infection, while T cells were most enriched in patients who survived.
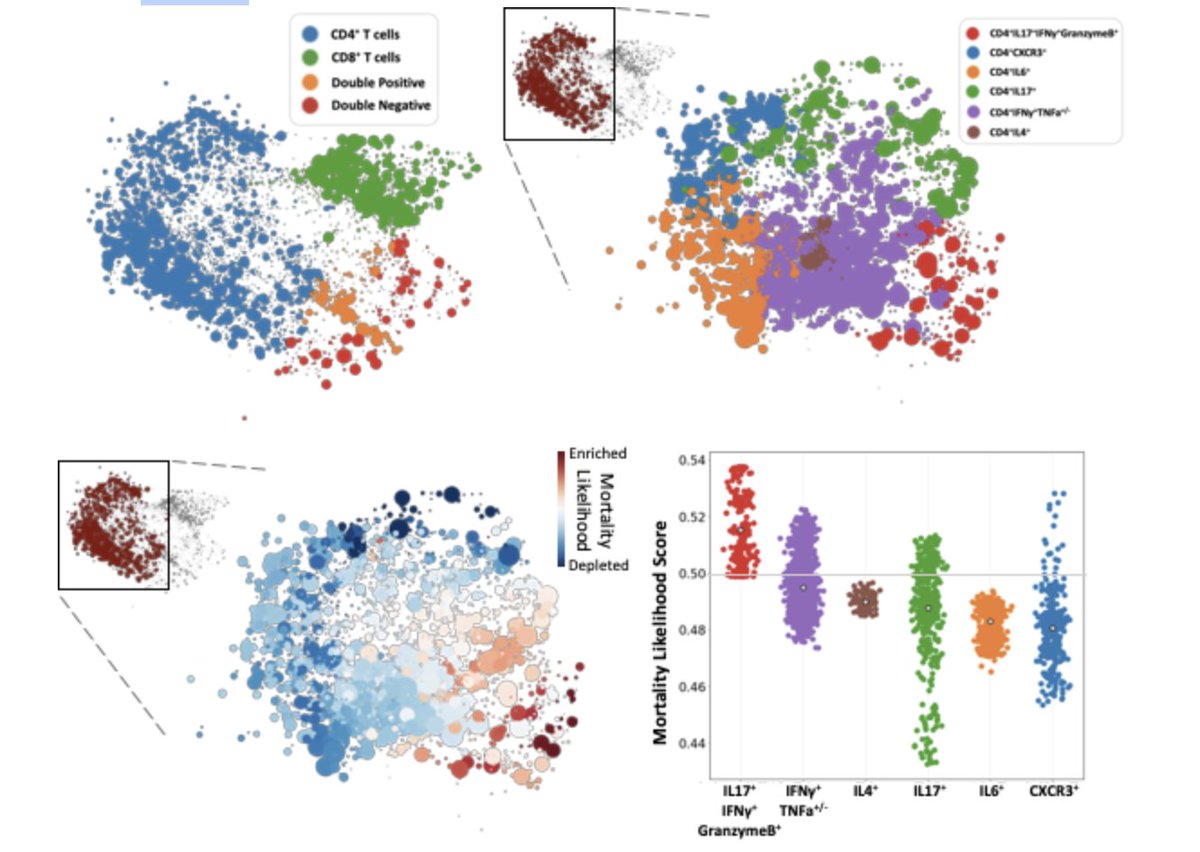
(8/n) Although T cells were associated with mortality, Pathogenic Th17 cells were enriched in patients that died from infection, highlighting the need for analysis at multiple levels of granularity.
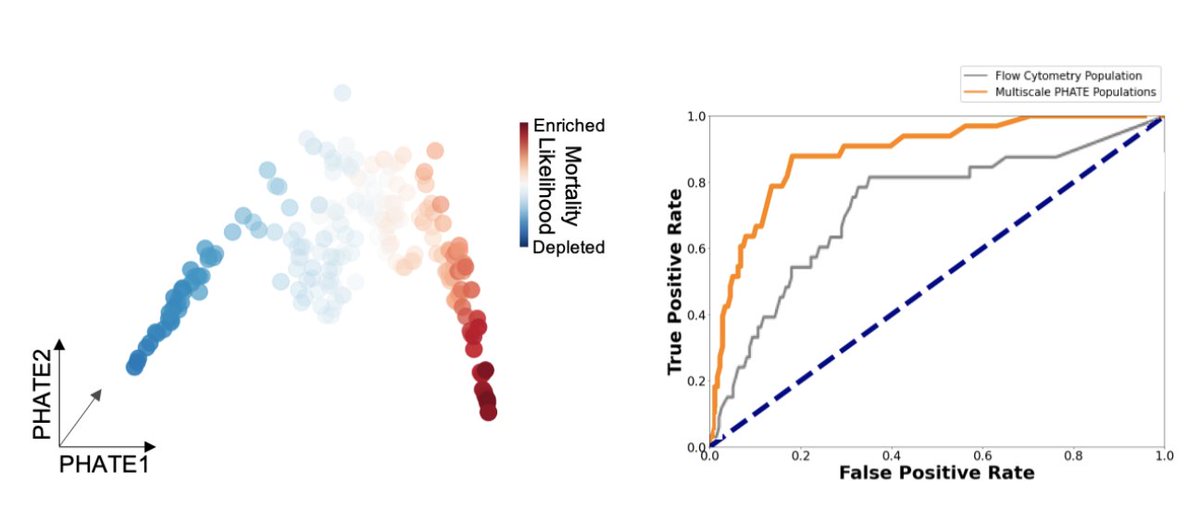
(9/n) Finally, we use Multiscale PHATE features to create patient-level descriptors for a patient manifold embedding. On this patient manifold we identify a region enriched for patients that die from infection. We also train a classifier directly on these features.
(10/n) If you are interested in using Multiscale PHATE for your data please check out our github repository at: github.com/KrishnaswamyLa…
• • •
Missing some Tweet in this thread? You can try to
force a refresh