TWEETORIAL: PHATE, our dimensionality reduction and #dataviz method featured on the cover of today’s @NatureBiotech! To help spread the word, @scottgigante and @DBBurkhardt put together this #tweetorial for you. nature.com/articles/s4158… (1/10)
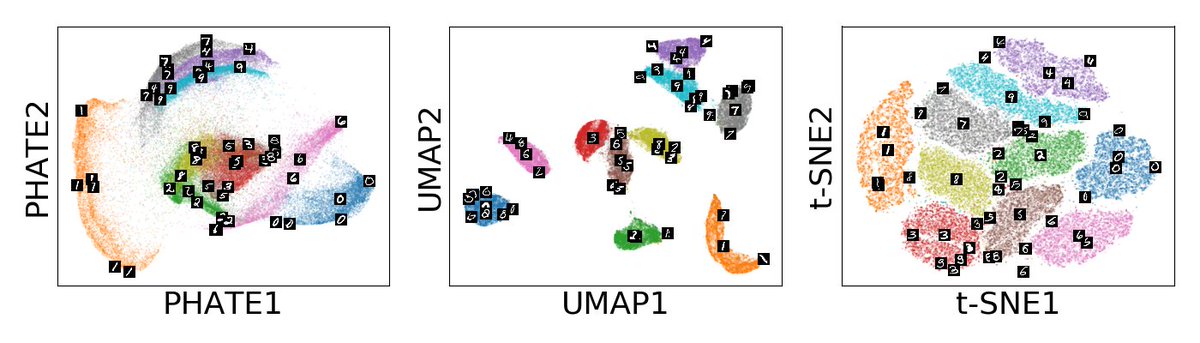
PHATE is a dimensionality reduction algorithm designed for visualizing all kinds of data. Here we show 16K differentiating stem cells measured with scRNA-seq. Unlike tSNE and UMAP, PHATE doesn’t create “blobs” and instead preserves continuous structures in the data (2/10) 

Because it works so well on continuous data, people often ask if PHATE assumes trajectory structure. It doesn’t!
Here is PHATE on MNIST. It’s not as separated as tSNE, but neither are the digits in reality -- if you look at UMAP, you can find a 2 in the 8s cluster, etc. (3/10)
Here is PHATE on MNIST. It’s not as separated as tSNE, but neither are the digits in reality -- if you look at UMAP, you can find a 2 in the 8s cluster, etc. (3/10)
How does PHATE work?
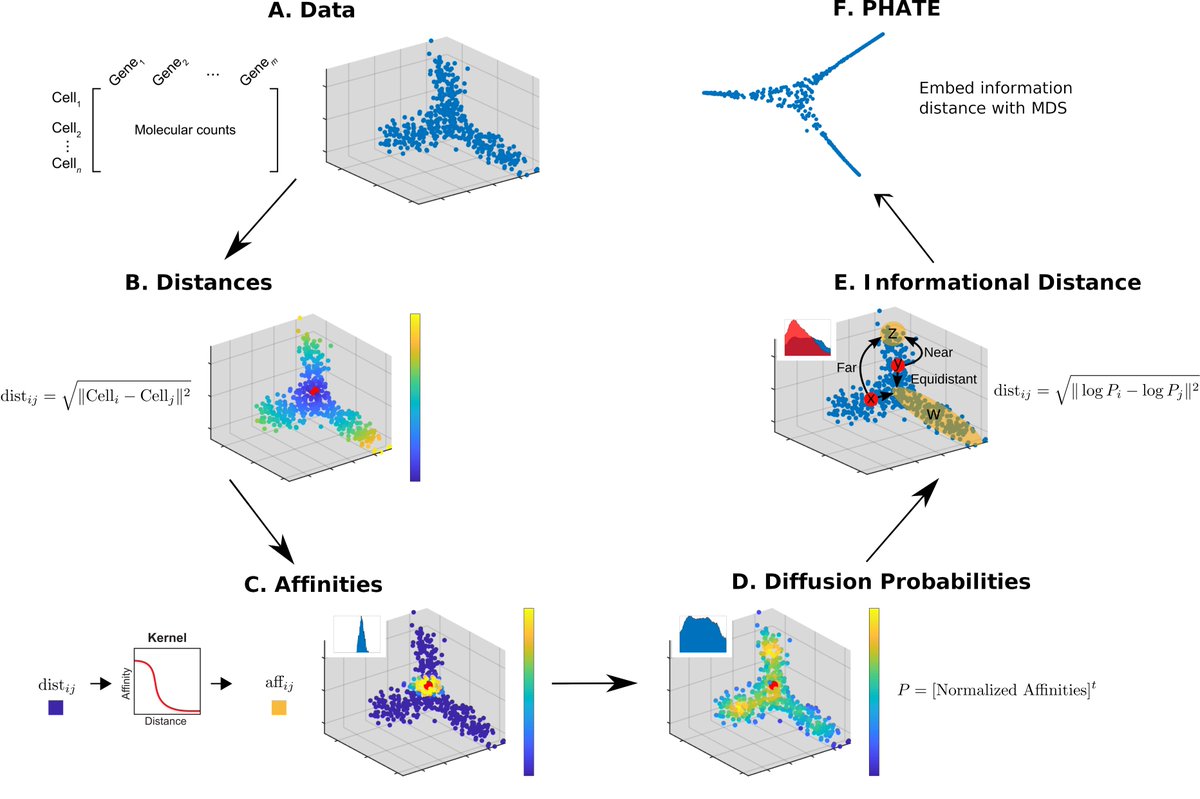
PHATE represents data by diffusion probabilities (from diffusion maps) to *all* other points in the data. Next, we calculate an informational distance between these sets of diffusion probabilities and compress these relationships in 2D or 3D via MDS (4/10)
PHATE represents data by diffusion probabilities (from diffusion maps) to *all* other points in the data. Next, we calculate an informational distance between these sets of diffusion probabilities and compress these relationships in 2D or 3D via MDS (4/10)
PHATE considers diffusion distances between all points, so continuous progressions are preserved.
In these linked clusters from @GoogleAI’s article pair-code.github.io/understanding-… by @_coenen & @adamrpearce, t-SNE and UMAP break up trajectories while PHATE keeps it all together (5/10)
In these linked clusters from @GoogleAI’s article pair-code.github.io/understanding-… by @_coenen & @adamrpearce, t-SNE and UMAP break up trajectories while PHATE keeps it all together (5/10)
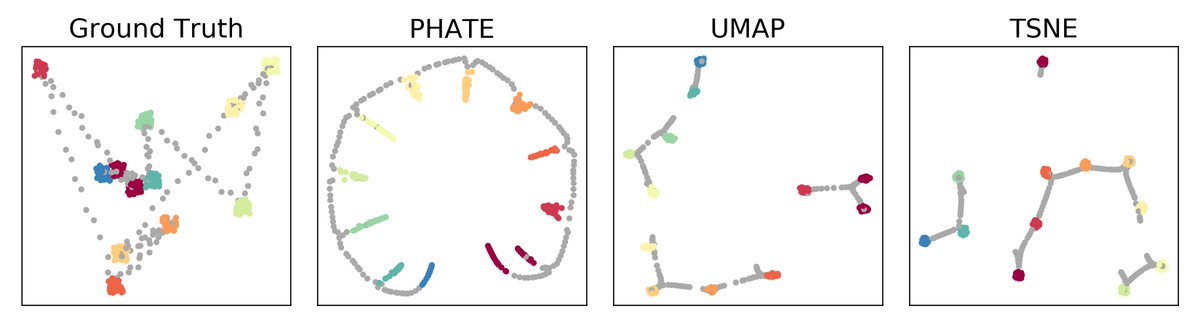
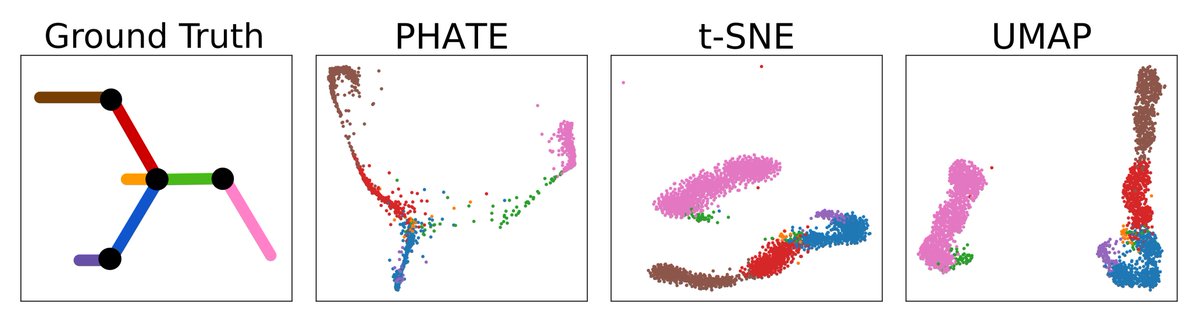
@GoogleAI @_coenen @adamrpearce Much like t-SNE before it, UMAP tends to break datasets into discrete clusters, even when the dataset is connected. Here you see simulations from @AliciaOshlack and @_lazappi_ ’s Splatter tool -- PHATE alone retains the sparse connection along the green branch (6/10)
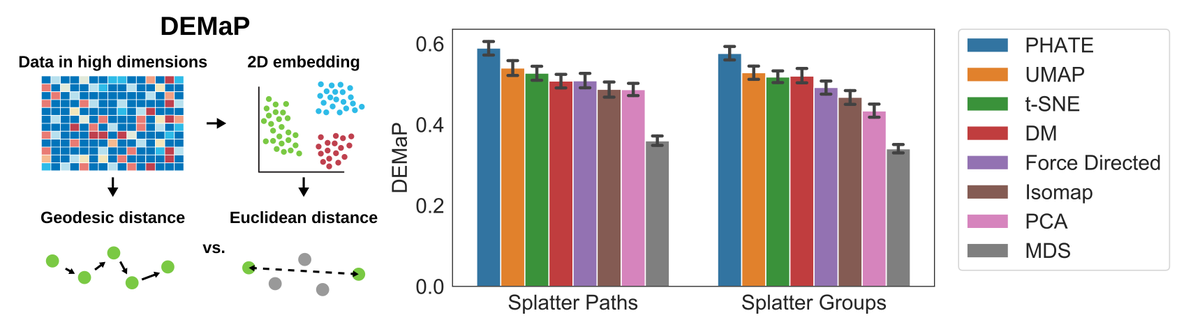
@GoogleAI @_coenen @adamrpearce @AliciaOshlack @_lazappi_ To quantify the visual advantage of PHATE, we developed Denoised Embedding Manifold Preservation (DEMaP) that measures how well embeddings of noisy data retain ground truth structure. PHATE outperforms all methods we tried on both trajectories (paths) and clusters (groups) (7/10)
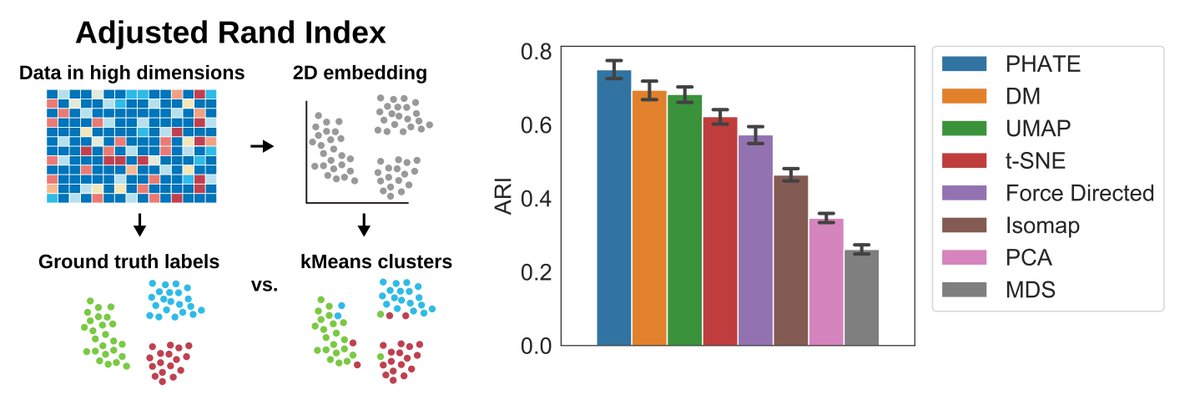
@GoogleAI @_coenen @adamrpearce @AliciaOshlack @_lazappi_ To our surprise, even using Adjusted Rand Index (ARI), a metric designed specifically for clusters, PHATE still performed better than t-SNE and UMAP, visualizations whose algorithms are biased towards cluster structures (8/10)
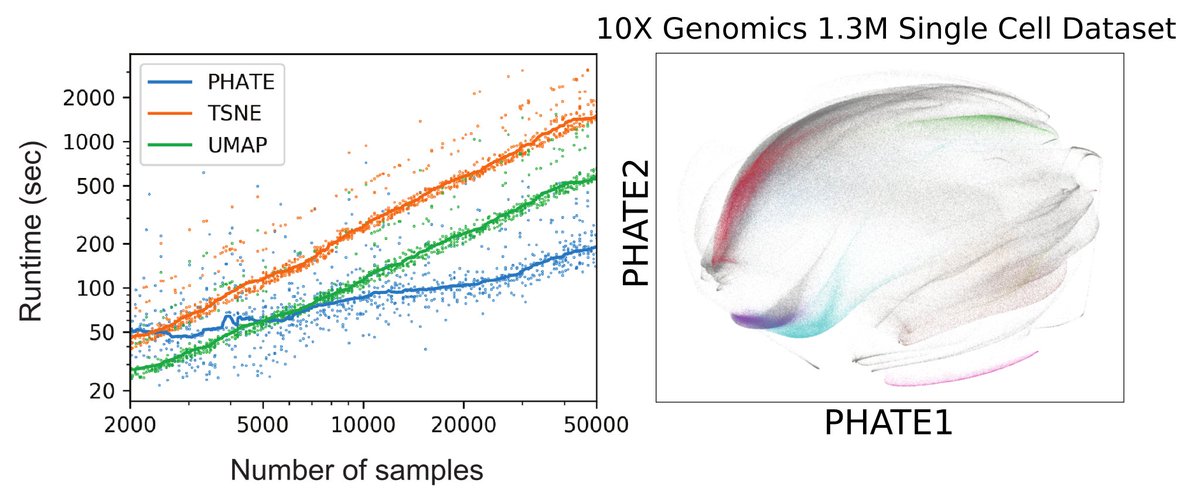
@GoogleAI @_coenen @adamrpearce @AliciaOshlack @_lazappi_ PHATE is fast and scales to large datasets. It’s also incredibly parallelizable. We ran PHATE on @10xGenomics 1.3M Megacell Demonstration in just three hours on a 36-core workstation! (9/10)
If you like what you see, check out PHATE at github.com/KrishnaswamyLa…. It’s available in #rstats, #python and #MATLAB. Thanks for reading! (10/10)