Analysis of voters who say they voted for Biden, but a Republican down ballot, via @NavigatorSurvey
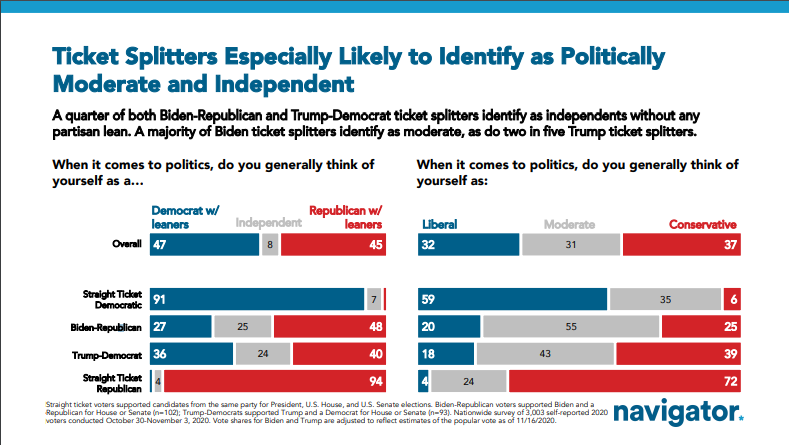
- R+21 in identification
- 55% moderate
- 55% suburban
- 65% income >50k
- 71% very unfav to DJT
And
- relatively progressive on key policy debates
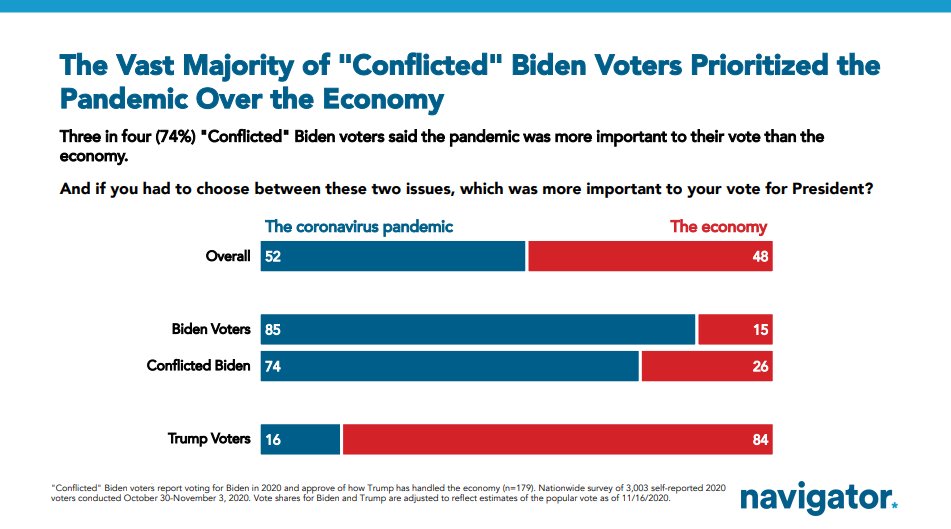
Among a not insignificant number of voters who say they voted for Trump in 2016 but Biden in 2020, 60% cite his handling of the pandemic as the reason to vote against him.
With the larger group of "new" Dems (who didn't vote/voted 3rd party in 2016), wider issue set at play.
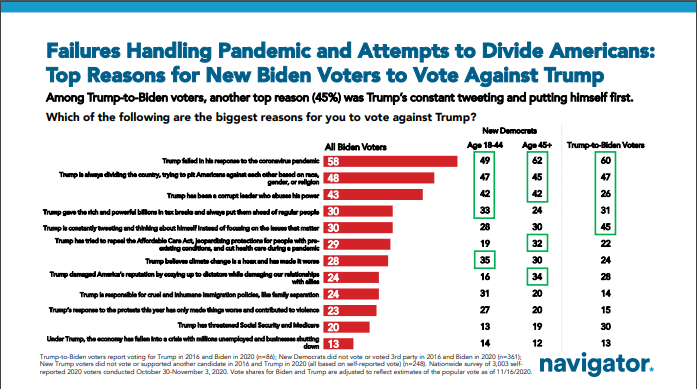
As a reason to vote for Biden, Biden's "new" supporters (those who didn't vote/didn't vote for Clinton in 2016) point to a range of issues... among those ages 18-44 it's
-Unity
-Covid plan
-For people, not 1%
-Climate
-Racial justice
For 45+ Medicare/SS and ACA also in top 5
This is all based on an n=3,000 survey of 2020 voters, based on self-reported vote choice, conducted Oct 30-Nov 3, and weighted to est. popular vote. Read more here: navigatorresearch.org/public-opinion…
Generally speaking the voters that joined the Democratic coalition in 2020 agree on quite a bit. On questions about taxes, health care, as well as immigration and choice.
• • •
Missing some Tweet in this thread? You can try to
force a refresh
It's always unclear how to interpret a midterm - but one thing that's become rather clear is the *relative* shifts we saw 2016-2018, regions within states and differences between states, were actually fairly informative of what we'd see in 2020. (think WI, AZ, GA, FL, IN suburbs)
It's uncanny really - not just the movement of FL relative to the country, but the reasons why (SoFL). There was Beto's underperformance vs. Clinton in the RGV. Iowa and Ohio largely bucking the environment in one direction; Minnesota in the other.
11% of Biden voters approved of Trump on the economy, which is how it was possible for Trump to lose by almost 5 points despite +5 rating on the economy.
When we asked this "conflicted" 11% whether covid or the economy was more important to their vote, it wasn't close.
The Trump camp probably saw these voters, who approved of him on what's usually the no. 1 issue (the economy) as a key target. Maybe rightfully. But ultimately the ones who voted for Biden did not buy into the whole Trump thing despite the positivity on the economy.
Some random places where votes come in late. MS and AR have been oddballs in showing smaller turnout increases and 1-2pt growth in Trump's margin from 2016. NYT had them at >98% counted, but votes added since weekend shrunk Trump margin -0.4% in AR and -1.1% in MS.
"Twyman's law' has been valuable for gut-checking partially counted results so far -- if it seemed especially unusual or interesting, it's probably wrong [not fully counted]*
*except if it's Florida
Same rule would suggest there are like, some overwhelmingly Dem uncounted ballots that would move Biden's margin from +13 to like +25 (a ~2pt improvement over Clinton). Also suggests micro things like "Biden didn't actually lose Mahoning." But we'll know for sure soon...
In some cases, the final margin will look like what we have now. In others, while it may not flip the state, if these are disproportionately "late mail" for example, the remaining votes could be *very different* than what's been seen so far.
And, I cannot emphasize this enough, there are as many as 5 to 6 MILLION votes yet to be counted in California alone.
An entire North Carolina yet to be posted, just in that state.
I think in terms of swing 2016-2020, depending on what's left in certain states, the story is *very much unwritten* until we have these last tranches of ~15-20% of the vote.
Recognize the urge to keep looking at RCP for the historical trends and comparison, but one (small) great thing about getting through another election cycle is those trends get older and there is one more reason to ignore RCP's opaque, mysterious averages.
RCP's lack of transparency, besides being just bad practice by today's data reporting standards, is frankly suspicious and makes it more plausible the aggregator is putting its thumb on the scale to help a candidate, party, or someone/thing else.
This is true. Someone should create an easy-to-navigate resource for historical polling averages so people can easily make apples-to-apples comparisons without resorting to the RCP black box.
Most of the final national polls seem to be in and Biden is at +8.6 in 538. If you apply "how red/blue was each state compared to Clinton's +2.1 in 2016?" you get:
(Winning everything up to Georgia = 350 electoral votes for Biden)
If you look at *state polling averages* and compare to the 2016-replay estimates, here's how polls suggest each state has changed in terms of partisan lean.
FL ⟶R+4
PA →R+1
NC →R+<1
GA ←D+<1
AZ ←D+<1
IA ←D+1
TX ←D+1
OH ←D+1
MI ⟵D+2
WI⟵D+3