Update to English hospital deaths by date. Headline reported total is 346 (282 yesterday, 317 last Thurs).

5-day reporting total up from 225 to 240 (at 14th Nov). No sign yet of exceeding the 9th Nov peak, but will have to watch 17th & 18th Nov.
Here are the trends in the like-for-like 5-day reporting total for the past month. 7-day average down a little to 242 (at 14th Nov) ...
... compared to 645 at the peak in April
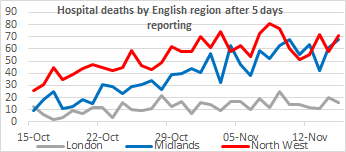
And here are the regional trends in English hospital deaths, again using the 5-day reporting totals.

• • •

Missing some Tweet in this thread? You can try to force a refresh
 

Keep Current with David Paton

David Paton Profile picture

Stay in touch and get notified when new unrolls are available from this author!

Read all threads

This Thread may be Removed Anytime!

PDF

Twitter may remove this content at anytime! Save it as PDF for later use!

Try unrolling a thread yourself!

how to unroll video
  1. Follow @ThreadReaderApp to mention us!

  2. From a Twitter thread mention us with a keyword "unroll"
@threadreaderapp unroll

Practice here first or read more on our help page!

More from @cricketwyvern

20 Nov
After their disastrous forecast for 26 Oct, MRC doubled down. On 3 Nov (just before lockdown), their mid-point prediction was for 545 deaths on 14 Nov, with a range of 380 to 710. Image
Deaths for the 14th should be fairly complete now and the total for the 14th is 336. The 7-day average is a bit higher (346), but still well short even of the MRC's lower bound estimate. Image
As I said last time, forecasting is difficult. But this was made just 11 days out so based largely on infections already occurred & tests already completed. Further, forecast range was very wide whilst MRC use the broadest "within 60 days of a positive test" deaths definition.
Read 5 tweets
20 Nov
The NI Executive decision to lockdown again next week is just astounding.

These sort of draconian measures, causing economic & social devastation as they do, should only be considered when there is an urgent crisis and there is absolutely no alternative.
bbc.co.uk/news/uk-northe…
According to the ONS infections in NI are coming down rapidly: 34% drop since late October.

That is consistent with the NI positive test data. The numbers had flattened around 8th Nov, but coming down steadily again now (ignore the last few days as these will be updated): Image
Covid-19 hospital admissions also coming down steadily in NI since end October (again ignore last few days). Image
Read 6 tweets
20 Nov
Update to English hospital deaths by date. Headline reported total 326 (yesterday 346, last Fri 246).

5-day reporting total up from 240 to 275 (at 15 Nov). Looking like 18th Nov might rival the 9th Nov peak.
Here are the trends in the 5-day reporting total for the past month and since April. 7-day average now at 245 (on 15 Nov) compared to 645 at the peak. ImageImage
And here are the regional trends in English hospital deaths using the like-for-like 5-day reporting totals. Still dominated by NW, NE&Y and Mids. ImageImage
Read 4 tweets
16 Nov
They may be the isolation rules now. The question is whether they *should* be the rules.

There is no 100% guarantee. e.g. infection may be possible even after 14 days but it is highly unlikely.

Also, reinfection may be possible but again, seems to be highly unlikely ...

1/7
... On the other hand, isolation imposes a significant cost both on individuals but also on hospitals, business, schools.

So we need to compare the likely benefits of the rules against their costs.

2/7
Having a 14-day rule rather than 7 or 10 days may increase the risk, but only slightly & not at all clear it justifies the additional costs.

When you factor in that compliance is likely to be lower, the longer the isolation, the case for 14 days is even weaker

3/7
Read 7 tweets
14 Nov
This is an odd headline.

France reported 356 deaths today about the same as last Sat (354) & much lower than yesterday (Fri's figures tend to be high).

Also positive tests & hospitalisations have been decreasing for a while & before the 30 Oct lockdown could have had an effect.
Hospitalisations peaked on 4th Nov. Positive tests started decreasing on 2nd Nov.

The test graph shows the 7-day incidence rate. Not sure if that is by result or test date but even if the latter, still far too early for the 30th Oct lockdown to be the cause.
And here is France's estimated R-number, falling steadily from 24th October with no indication that the 30th October lockdown had any effect on the trend at all.
Read 4 tweets
7 Nov
There seems to be a systematic pattern to how the Government presents forecasts/predictions/scenarios to justify more restrictions & lockdowns.

It’s important they are held up to scrutiny after the event.
On 16 Oct, @BorisJohnson justified forcing Tier 3 restrictions onto Greater Manchester because “On recent trends in just over two weeks there will be more Covid patients in intensive care than at the peak of the 1st wave”. mirror.co.uk/news/politics/…
At the peak, NHS report GM Trusts had 171 patients in mechanically ventilated beds (their best measure of ICU numbers).

As of 3 Nov (2.5 weeks after the PM's statement but too early for any Tier 3 effect) MV patients have increased but to 96, still just 56% of the April peak.
Read 5 tweets

Did Thread Reader help you today?

Support us! We are indie developers!


This site is made by just two indie developers on a laptop doing marketing, support and development! Read more about the story.

Become a Premium Member ($3/month or $30/year) and get exclusive features!

Become Premium

Too expensive? Make a small donation by buying us coffee ($5) or help with server cost ($10)

Donate via Paypal Become our Patreon

Thank you for your support!

Follow Us on Twitter!