Just a couple of interesting US bond market observations from your friendly neighbourhood bond bull to close out the week.

1) Long duration bonds (TLT) are still looking like they’re setting up for their next big move higher. Image
2) A close below long-term support would be a clear negative, but for the time being we continue to hold. Image
3) Speculators remain near record short as a % of total open interest. Image
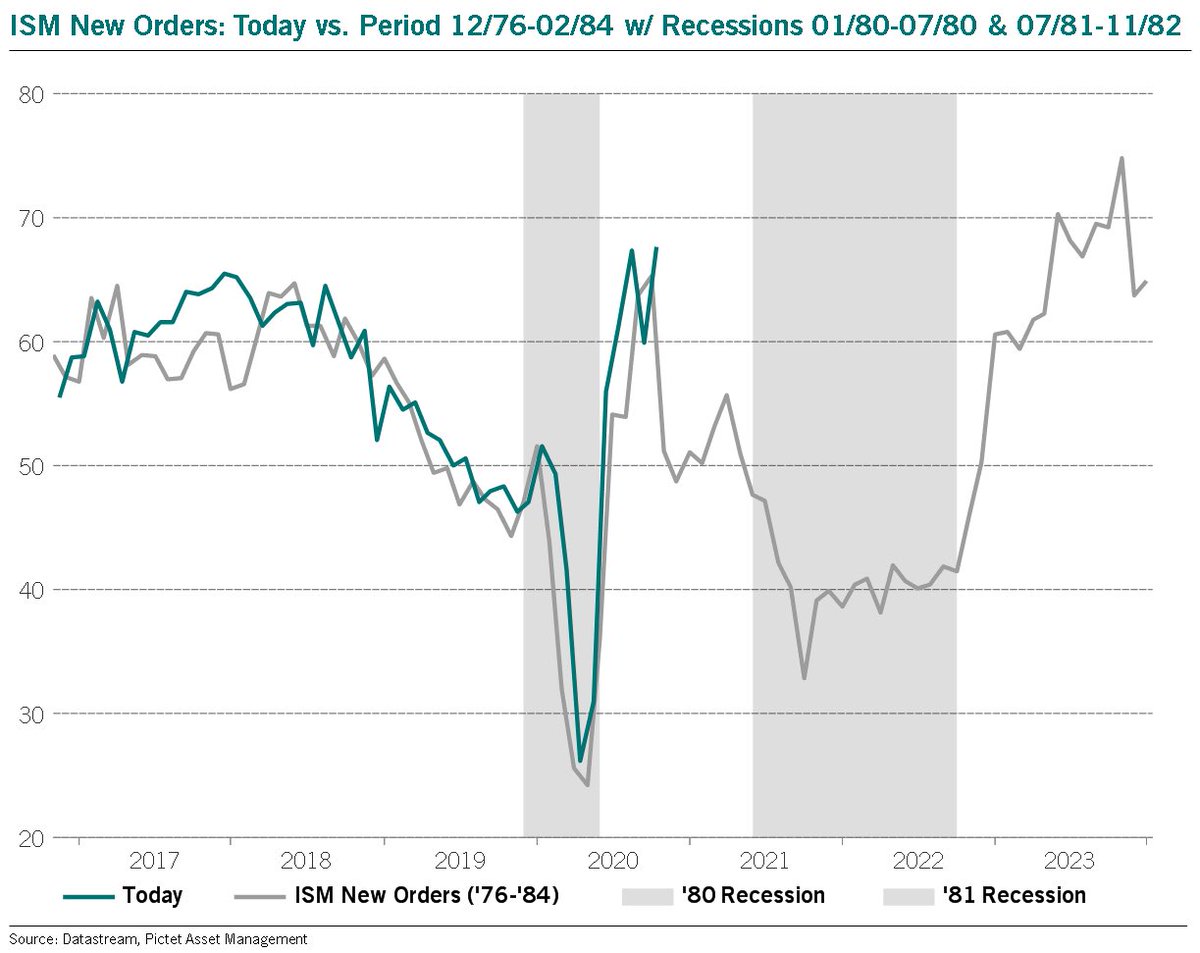
4) And US economic momentum peaked almost 5 months ago... Image
5) TIP/TLT is currently into some important resistance levels.

In RSI terms there are several layers of overhead resistance & trend support looks to be broken.

Weekly close is important. Image
6) IEF/TLT has been rejected at resistance (again) following its cycle peak in Q4 2018.

False breakout?

We closed below the 50DMA yesterday for the first time since August, but RSI has yet to confirm.

Nice RSI divergence though.

Watching all of this very closely. Image

• • •

Missing some Tweet in this thread? You can try to force a refresh
 

Keep Current with Julien Bittel, CFA

Julien Bittel, CFA Profile picture

Stay in touch and get notified when new unrolls are available from this author!

Read all threads

This Thread may be Removed Anytime!

PDF

Twitter may remove this content at anytime! Save it as PDF for later use!

Try unrolling a thread yourself!

how to unroll video
  1. Follow @ThreadReaderApp to mention us!

  2. From a Twitter thread mention us with a keyword "unroll"
@threadreaderapp unroll

Practice here first or read more on our help page!

More from @BittelJulien

9 Nov
ISM Manufacturing New Orders rose to 67.9 in October, their highest lvl since Jan ‘04.

While quite a few US macro indicators continue to track an ‘01 analog (NFIB, consumer conf., heavy truck sales, etc.), it’s interesting to see how closely ISM NOs are mirroring the early 80’s.
Even the magnitude of the move is identical: a 40pt rise over 6M.

Back then, this marked the peak & what followed was a 12M decline in new orders from Nov ‘80-Nov ‘81.

Equities officially bottomed in Aug ‘82, which was the true cycle low & an 8Y bull mkt in equities started.
Additionally, the only other period in the last 50Y where we had a similar bounce in economic activity with my US macro composite still in the 50th percentile, was the early 80’s.

Bull markets with legs usually occur with a cross <20%. Think of this as a macro valuation score.
Read 24 tweets
7 Apr
A rise in the US UR of >0.5% off 24M rolling lows has been the 100% threshold for recession. This has historically corresponded w/ deep equity bear mkts. In ‘01/‘08, equities went on to fall another 35%/50% after the signal. Strategic buying opportunity for equities? Not yet imo.
Here is the long-term chart of the US unemployment rate deviation from 24M rolling lows. A monthly close above 0.5% has a 100% track record over 70Y at signalling a recession.
Meanwhile, my US cycle risk index is currently at 68% & suggests that the US unemployment rate will rise ~3.5% above 24M rolling lows. My guess is this lead index will soon be nearer 100%.
Read 4 tweets

Did Thread Reader help you today?

Support us! We are indie developers!


This site is made by just two indie developers on a laptop doing marketing, support and development! Read more about the story.

Become a Premium Member ($3/month or $30/year) and get exclusive features!

Become Premium

Too expensive? Make a small donation by buying us coffee ($5) or help with server cost ($10)

Donate via Paypal Become our Patreon

Thank you for your support!

Follow Us on Twitter!