
You think you've identified a new, useful predictive factor for trading...
But is it really new? Or just another way of looking at something you already know about?
How might you tell? Here are some simple ways...
A research thread 👇👇👇
But is it really new? Or just another way of looking at something you already know about?
How might you tell? Here are some simple ways...
A research thread 👇👇👇
https://twitter.com/therobotjames/status/1326755668368396289
First, put aside any expectation that you can isolate and quantify effects with great precision.
The market is a highly efficient beast - why means that any non-random effects we observe tend to be extremely noisy.
But just cos something is hard, doesn't mean we shouldn't try.
The market is a highly efficient beast - why means that any non-random effects we observe tend to be extremely noisy.
But just cos something is hard, doesn't mean we shouldn't try.
In fact, it's essential that we try to understand and isolate effects as best we can.
The best tools for the job (at least to start) are:
- economic intuition
- very simple data analysis (the kind of thing you could do in an excel pivot table)
The best tools for the job (at least to start) are:
- economic intuition
- very simple data analysis (the kind of thing you could do in an excel pivot table)
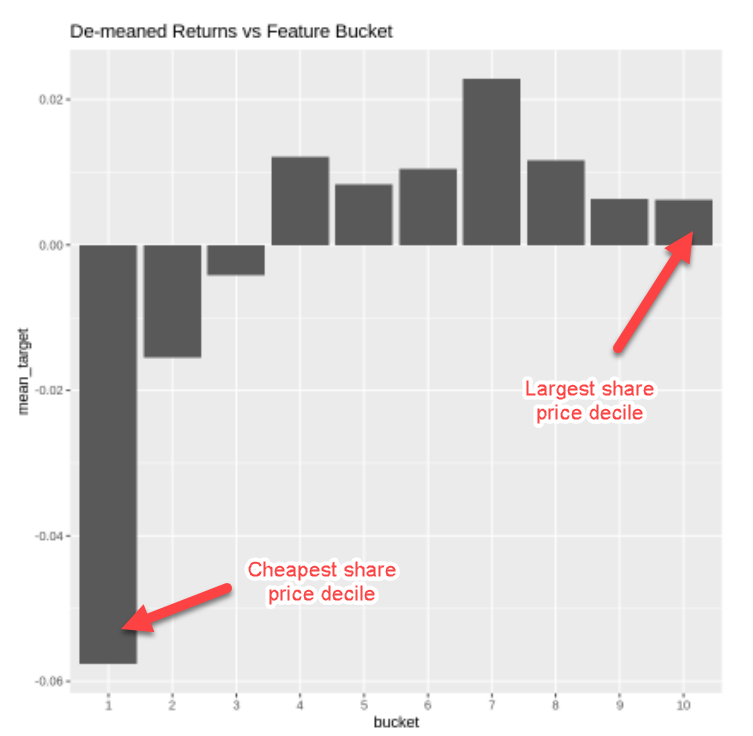
Last week we looked at an extremely simple factor: the share price of a stock.
We found that stocks with the lowest share prices tended to have lower forward returns.
We found that stocks with the lowest share prices tended to have lower forward returns.
Now, we know a low stock price doesn't *cause* future returns to be lower. That would be silly.
But we thought that stocks with very low share prices may be attractive to a low capitalized seeker of stock returns - whose marginal demand may bid up these stocks.
But we thought that stocks with very low share prices may be attractive to a low capitalized seeker of stock returns - whose marginal demand may bid up these stocks.
This is *plausible*.
And we *want* it to be true (cos then we've found a new effect we might harness.)
But we can't always get what we want.
So we must ask "Is this just something we already know about?"
And we *want* it to be true (cos then we've found a new effect we might harness.)
But we can't always get what we want.
So we must ask "Is this just something we already know about?"
Economic intuition comes before statistics.
What do we already know about that might be causing this?
Well, it is well known that high volatility assets tend to have very poor long-run returns.
You can read about this in Antti Ilmanen's Expected Returns here...
What do we already know about that might be causing this?
Well, it is well known that high volatility assets tend to have very poor long-run returns.
You can read about this in Antti Ilmanen's Expected Returns here...

We suspect high vol assets are attractive to those who like lotterylike yolo payoffs or who dislike leverage or can't access it easily.
This creates excess demand for highly volatile stocks, which makes them more expensive, which makes their future expected returns lower.
This creates excess demand for highly volatile stocks, which makes them more expensive, which makes their future expected returns lower.
So do stocks with lower share prices tend to underperform simply because they tend to be more volatile stocks?
Or is there something else going on?
Let's look...
Or is there something else going on?
Let's look...
First, we calculate a volatility factor - which will just be the annualised volatility of the stock over the last 252 trading days (1 year).
I'm using the same dataset as in the linked thread at the top...
I'm using the same dataset as in the linked thread at the top...

Now we want to answer the question:
Do stocks with low share price also tend to be high volatility stocks (and vice versa)?
A scatterplot is a useful tool for this. For each yearly stock observation plot its past volatility on the y axis and the log share price on the x axis.
Do stocks with low share price also tend to be high volatility stocks (and vice versa)?
A scatterplot is a useful tool for this. For each yearly stock observation plot its past volatility on the y axis and the log share price on the x axis.

It's quite clear that stocks with low share prices tend to be higher volatility stocks.
This suggests what we are seeing could well be a high-volatility effect.
Now we want to see if our share price effect goes away if we control for the high volatility effect.
This suggests what we are seeing could well be a high-volatility effect.
Now we want to see if our share price effect goes away if we control for the high volatility effect.

First, let's look at the volatility effect itself.
We sort all our annual stock observations into deciles by rising volatility and plot the mean of their log returns the following year.
It's pretty clear the high vol stuff tends to have crappy returns.
We sort all our annual stock observations into deciles by rising volatility and plot the mean of their log returns the following year.
It's pretty clear the high vol stuff tends to have crappy returns.

What if we filter out the highly volatile stuff from our analysis?
If we only look at the stuff that appears in volatility deciles 1-8, do we still see any "signal" in our share price factor?
Do lower volatility stocks with low share price still have worse returns?
If we only look at the stuff that appears in volatility deciles 1-8, do we still see any "signal" in our share price factor?
Do lower volatility stocks with low share price still have worse returns?

So we:
- filter out all the high vol stocks (vol_bucket <= 8)
- plot the mean log return for each share price bucket for the remaining low and moderate volatility stocks.
And it no longer looks interesting!
- filter out all the high vol stocks (vol_bucket <= 8)
- plot the mean log return for each share price bucket for the remaining low and moderate volatility stocks.
And it no longer looks interesting!

Once we've controlled for the high volatility effect, the share price doesn't seem to have anything interesting to add.
As often happens in the markets, it's unlikely we're going to get what we want here.
It's likely we just found another proxy for volatility.
As often happens in the markets, it's unlikely we're going to get what we want here.
It's likely we just found another proxy for volatility.
Now let's isolate the high vol stuff.
Does the share price allow us to discriminate between high vol stuff with better (less bad?) returns?
Nope. Doesn't seem to be anything there either!
Does the share price allow us to discriminate between high vol stuff with better (less bad?) returns?
Nope. Doesn't seem to be anything there either!

Now, I'd dig a little further if I weren't doing this in Tweets...
But at this point, I think we can say that it is very likely that the share price effect we saw is really just a volatility / "betting-against-beta" effect we already knew about.
Such is the way it goes :-)
But at this point, I think we can say that it is very likely that the share price effect we saw is really just a volatility / "betting-against-beta" effect we already knew about.
Such is the way it goes :-)
The good news is we understand the effect better now.
The less good news is it's likely just another crude way of looking at something we already knew about.
Here's a simple recipe of sorts for doing this kind of thing...
The less good news is it's likely just another crude way of looking at something we already knew about.
Here's a simple recipe of sorts for doing this kind of thing...
1. Use economic intuition to identify what else might explain the effect
2. Proxy that other thing as a factor
3. Look at the relationship between the two factors (scatterplot is good)
4. Control for one effect (as best you can) and see if the other factor still explains returns
2. Proxy that other thing as a factor
3. Look at the relationship between the two factors (scatterplot is good)
4. Control for one effect (as best you can) and see if the other factor still explains returns
Economic intuition and simple exploratory data analysis should always be your first port of call.
Don't rush into running regressions or the like without asking some good simple questions of the data first.
You'll get much more insight this way.
Don't rush into running regressions or the like without asking some good simple questions of the data first.
You'll get much more insight this way.
• • •
Missing some Tweet in this thread? You can try to
force a refresh


