.@EssexBarrister I appreciated your contribution yesterday to the discussion on Sky. Wondered if I might offer a few pieces of the puzzle re disproportionality in terms of crime and policing?
1/
1/
Nationally, '...among the broad ethnic groups, Black people were most likely to live in the 10% of neighbourhoods most deprived in relation to crime (27% of this group did so)’ ethnicity-facts-figures.service.gov.uk/uk-population-…
2/
2/
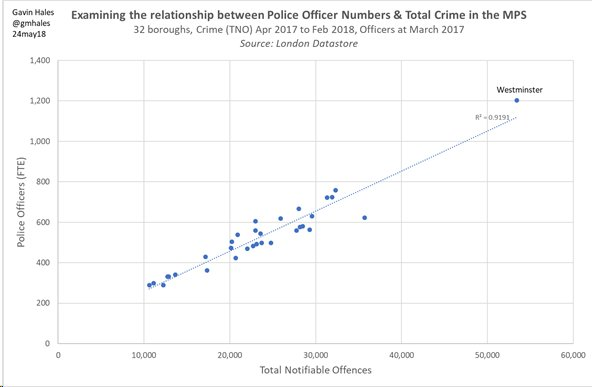
In London (and elsewhere), areas (here boroughs) with more crime are allocated more police officers (TNO = Total Notifiable Offences)
3/
3/
Nationally, Black respondents to the Crime Survey for England & Wales are 2x as likely as White to report high visibility of police foot patrols (28% vs 14%).
Source: Table s11 ons.gov.uk/file?uri=/peop…
4/
Source: Table s11 ons.gov.uk/file?uri=/peop…
4/

So Black people are exposed to more policing in part as a function of being more likely to live in more deprived neighbourhoods with higher crime rates which in turn are allocated more police resources.
5/
5/
Higher deprivation is associated with higher rates of murder...
6/
https://twitter.com/gmhales/status/988791700234686464?s=20
6/
Again in London, analysis by @MOPACLdn in their review of the #gangsmatrix shows that Black people are disproportionately affected by (esp more serious) violence as offenders and victims london.gov.uk/sites/default/…
9/
9/

Disproportionality in arrests varies by crime type - here I look at arrests of children by the Met (nb the importance of gender: disproportionality is higher for Black boys than girls) police-foundation.org.uk/2017/wp-conten…
10/
10/

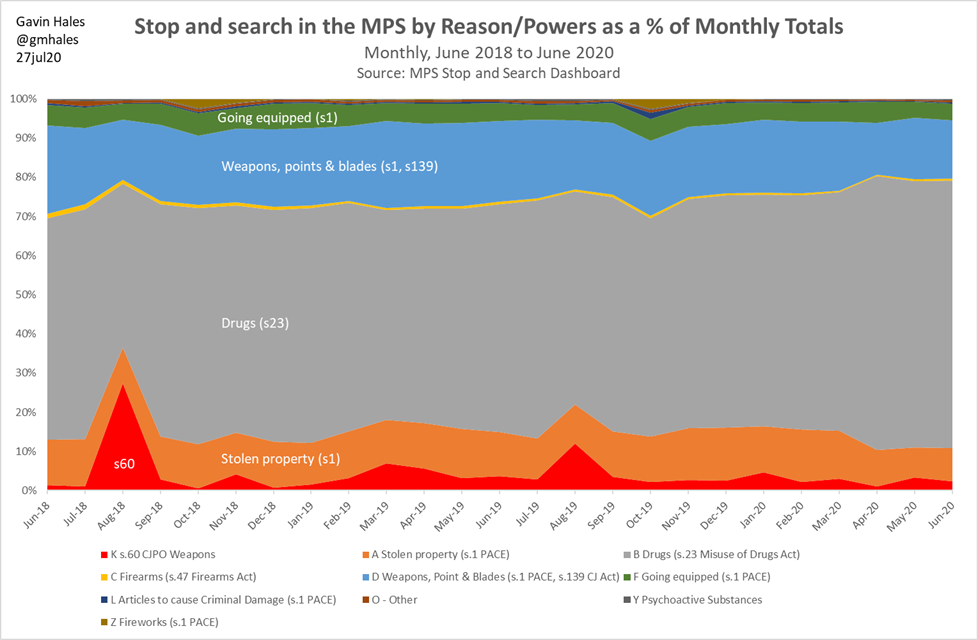
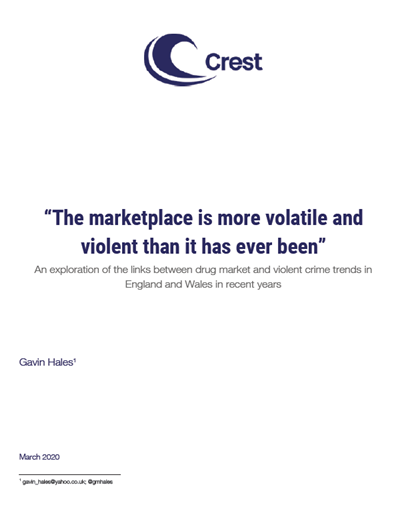
There are connections between drug markets and violence, most strongly in the case of retail-level crack and heroin dealing. …d-4419-a368-724e7d1352b9.usrfiles.com/ugd/b9cf6c_9fe…
11/
11/
My sense (fr research on gun crime & drugs markets, plus yrs spent around the policing of London), is drugs mkts recreate the structural inequalities of the mainstream econ, w Black youths/young adults disprop occupying the most risky posns (esp retail crack/heroin dealing).
12/
12/
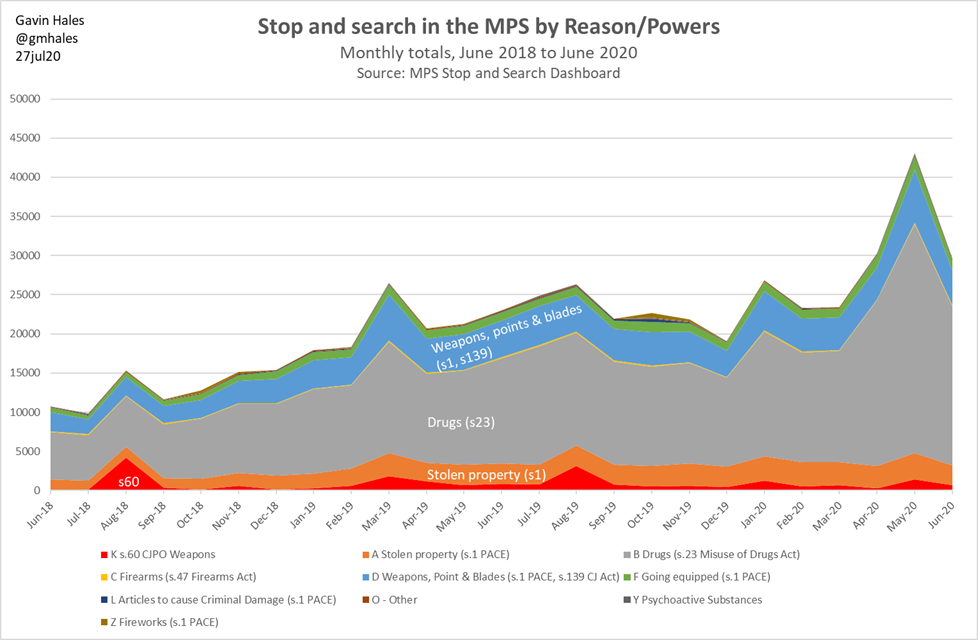
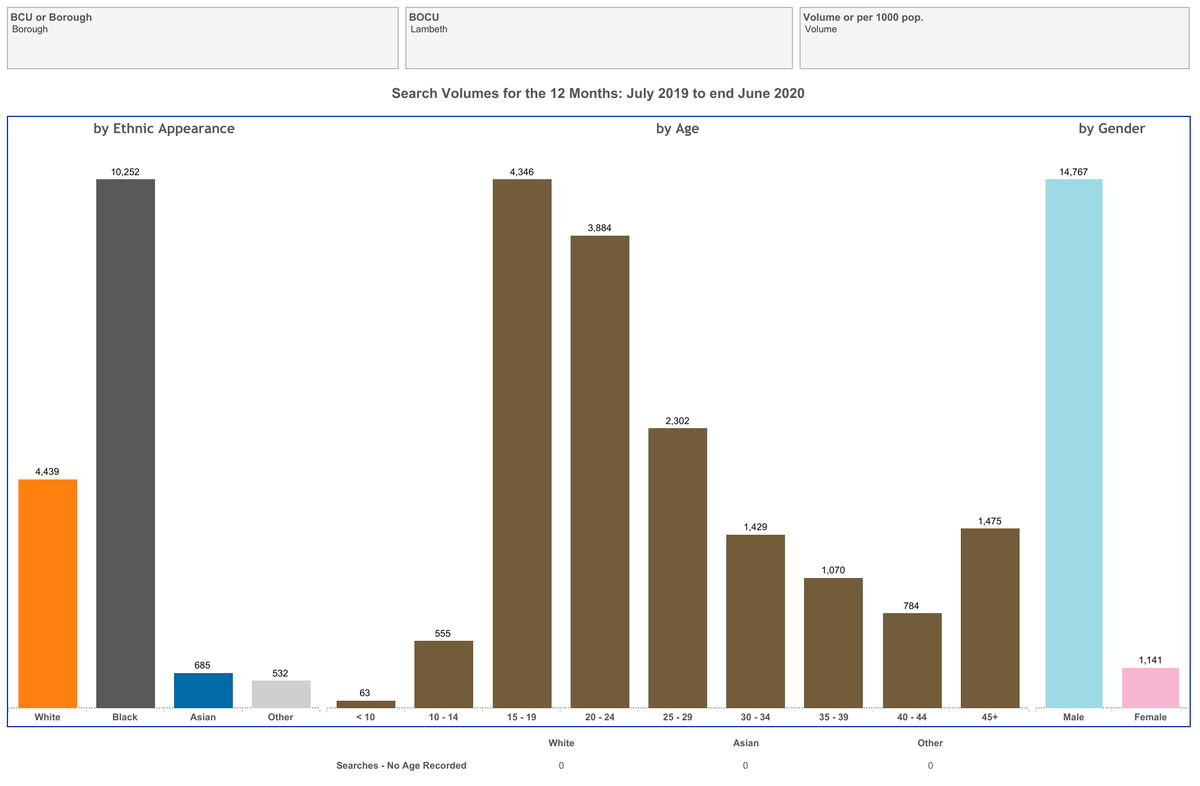
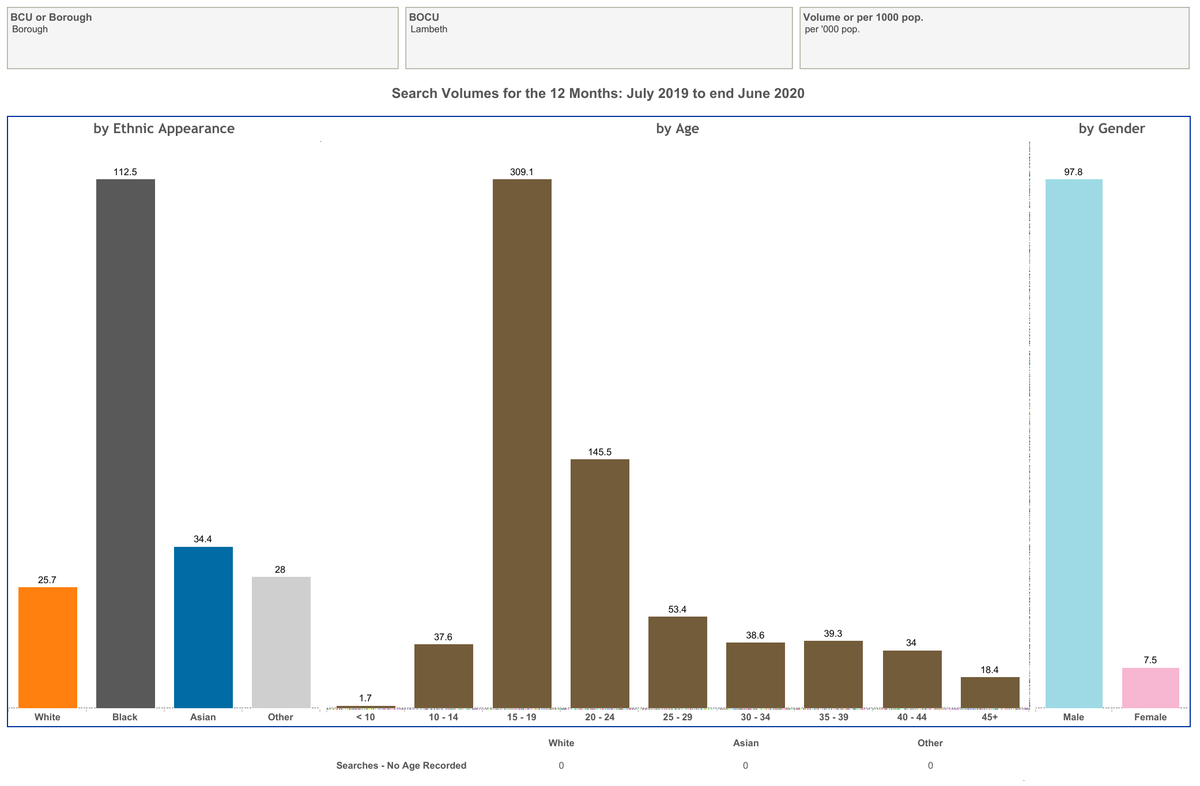
On #stopsearch, the national disproportionality figures (eg 9x) are skewed by the fact that the Met uses S&S at a much higher rate than other forces, and 58% of Black and Black mixed heritage people in E&W live in London.
13/
https://twitter.com/gmhales/status/1281658254637125632?s=20
13/
Still on #stopsearch, this discussion of logical fallacies re police suspicion may be of interest
14/
https://twitter.com/gmhales/status/1331253381671886848?s=20
14/
My analysis of Met police #useofforce data suggests frequency of Taser use is disproportionate in line with other police contact (S&S, arrests), but the profile of use is virtually identical betn White & Black subjects
15/
https://twitter.com/gmhales/status/1164440556837191680?s=20(caveats apply - see the thread)
15/
Incidentally, at the national level the gap betn Black & White respondents' confidence in local policing is betn Black Caribbean & White. Black African respondents express the same (actually v slightly higher) confidence in policing as White. ethnicity-facts-figures.service.gov.uk/crime-justice-…
16/
16/

Disproportionate/'over' policing is, I think, both a symptom & a cause of structural inequalities. The challenge that follows is how to respond to disproportionate vulnerability/harm without compounding it. How might an explicit 'do no harm' approach look different?
17/
17/
• • •
Missing some Tweet in this thread? You can try to
force a refresh

