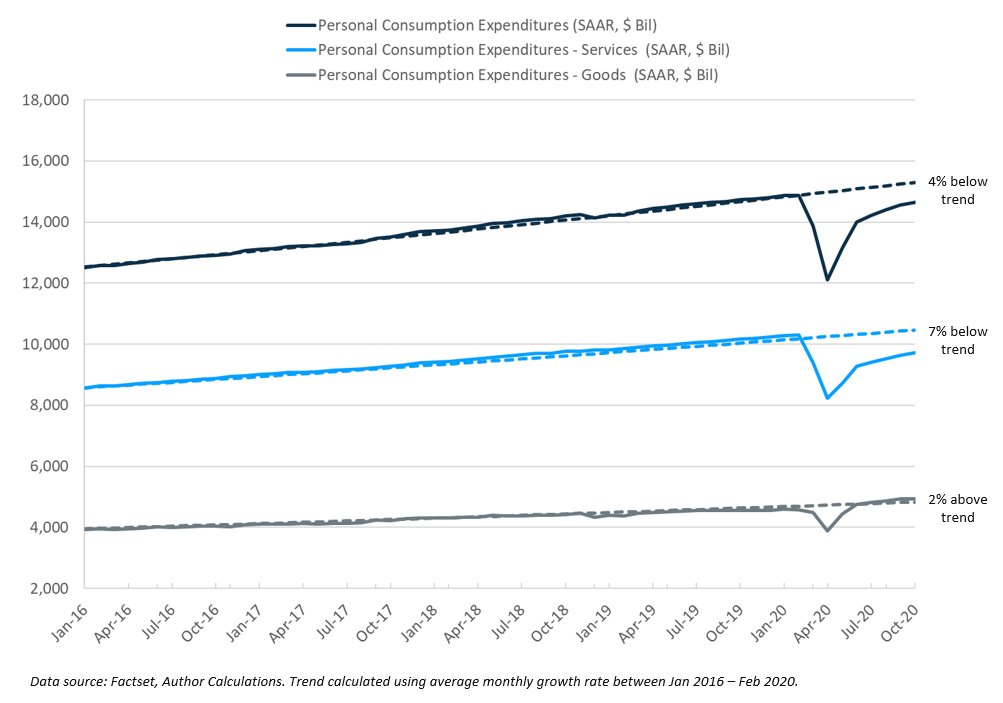
The 2020 stock market recovery should not be surprising given the V-shaped recovery in corporate profits, which are now higher than they were at the end of 2019 (h/t @lhamtil).
Thread on what drove this, using sectoral balances & Levy-Kalecki 👇
1/
Thread on what drove this, using sectoral balances & Levy-Kalecki 👇
1/

Levy-Kalecki profit equation recap:
Corporate Profits =
Investment
+ Dividends
- Household Saving
- Government Saving
+ Current Account Surplus
Business investment & current account surpluses are profit sources.
Household & government savings subtract from profits.
2/
Corporate Profits =
Investment
+ Dividends
- Household Saving
- Government Saving
+ Current Account Surplus
Business investment & current account surpluses are profit sources.
Household & government savings subtract from profits.
2/
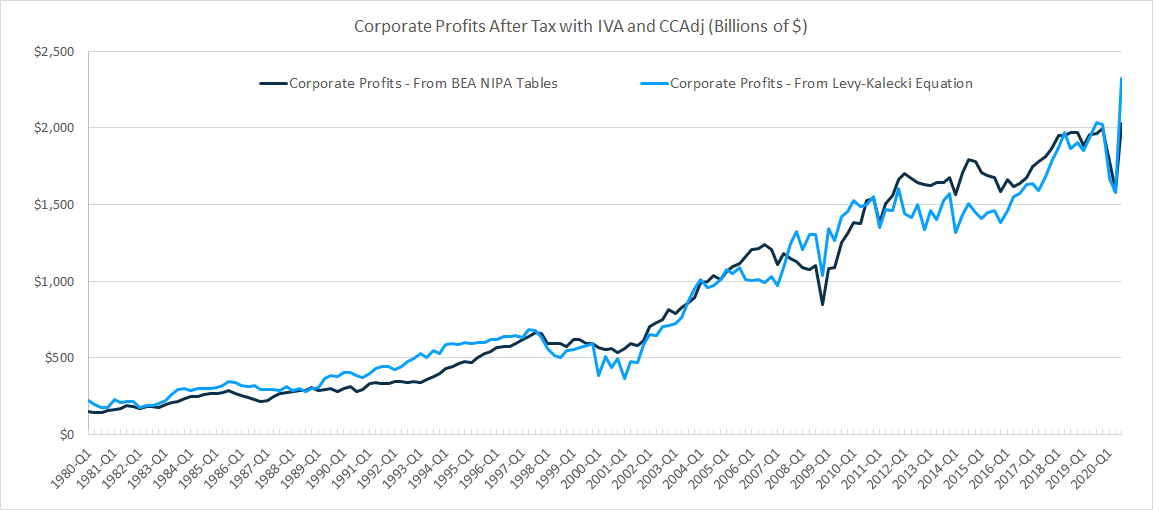
I used BEA's NIPA tables to compare corporate profits (collected directly) vs calculation using the profit equation.
Not a perfect match as the first chart shows.
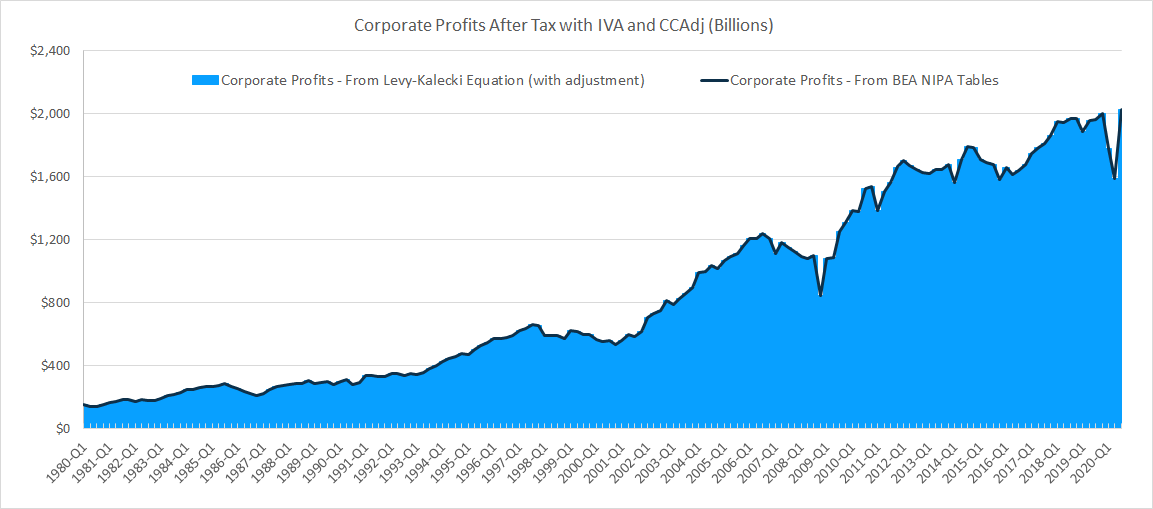
But you get an exact match by subtracting a discrepancy term (from BEA) to account for data collection errors.
3/
Not a perfect match as the first chart shows.
But you get an exact match by subtracting a discrepancy term (from BEA) to account for data collection errors.
3/
So here's cumulative growth of corporate profits & profit sources from 1993-2020 Q3.
You see big shifts, especially in household (blue) & government savings (orange) post-2008.
And 2020 Q2/Q3 are off the charts - more on this below.
4/
You see big shifts, especially in household (blue) & government savings (orange) post-2008.
And 2020 Q2/Q3 are off the charts - more on this below.
4/

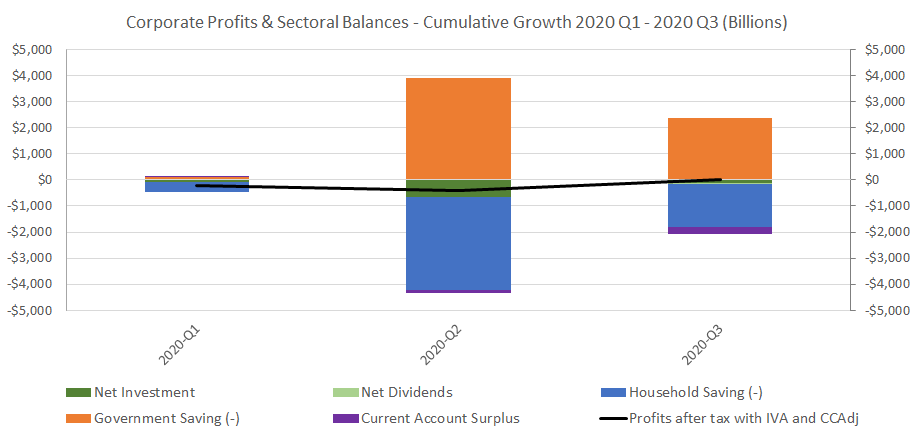
Focusing on 2020 Q1-Q3 cumulative growth.
We see huge increases in household savings (blue bars) & dropoff in investment spending (green) - both subtracting from profits.
But profits completely recovered (+$28B ytd) - thanks to negative govt savings i.e. deficits (orange).
5/
We see huge increases in household savings (blue bars) & dropoff in investment spending (green) - both subtracting from profits.
But profits completely recovered (+$28B ytd) - thanks to negative govt savings i.e. deficits (orange).
5/
Extending back a little further ...
Since 2016, profits are up $442B.
This is almost entirely on the back of fiscal deficits, which has made up for
- household deleveraging
- negligible investment
- higher current account deficits.
6/
Since 2016, profits are up $442B.
This is almost entirely on the back of fiscal deficits, which has made up for
- household deleveraging
- negligible investment
- higher current account deficits.
6/

Here's data from other sub-periods, including
2010-2015
2008-2009
2003-2007
2000-2002
1993-1999
(from a prior thread I did back in Feb) 👇
7/
2010-2015
2008-2009
2003-2007
2000-2002
1993-1999
(from a prior thread I did back in Feb) 👇
https://twitter.com/sonusvarghese/status/1225158230642429961?s=20
7/
Thread also has links to more info on Levy-Kalecki, incl
- primer from @RomanchukBrian
- a discussion between @DavidBeckworth & @teasri
- an old piece by @Jesse_Livermore
I highly recommend all 🙏
8/
- primer from @RomanchukBrian
- a discussion between @DavidBeckworth & @teasri
- an old piece by @Jesse_Livermore
I highly recommend all 🙏
8/
https://twitter.com/sonusvarghese/status/1225158206915301378?s=20
I do want to add a couple of more recent pieces.
Here @NathanTankus discusses "where profits come from" - definitely give it a read (& subscription)!
nathantankus.substack.com/p/where-do-pro…
9/
Here @NathanTankus discusses "where profits come from" - definitely give it a read (& subscription)!
nathantankus.substack.com/p/where-do-pro…
9/
For a deep dive, including the algebra & implications for markets, I highly recommend this mammoth piece by @Jesse_Livermore.
The 2020 profit scenarios don't look outlandish now!
As he noted, govt actions have quite literally changed the equation.
osam.com/Commentary/ups…
/end
The 2020 profit scenarios don't look outlandish now!
As he noted, govt actions have quite literally changed the equation.
osam.com/Commentary/ups…
/end
• • •
Missing some Tweet in this thread? You can try to
force a refresh