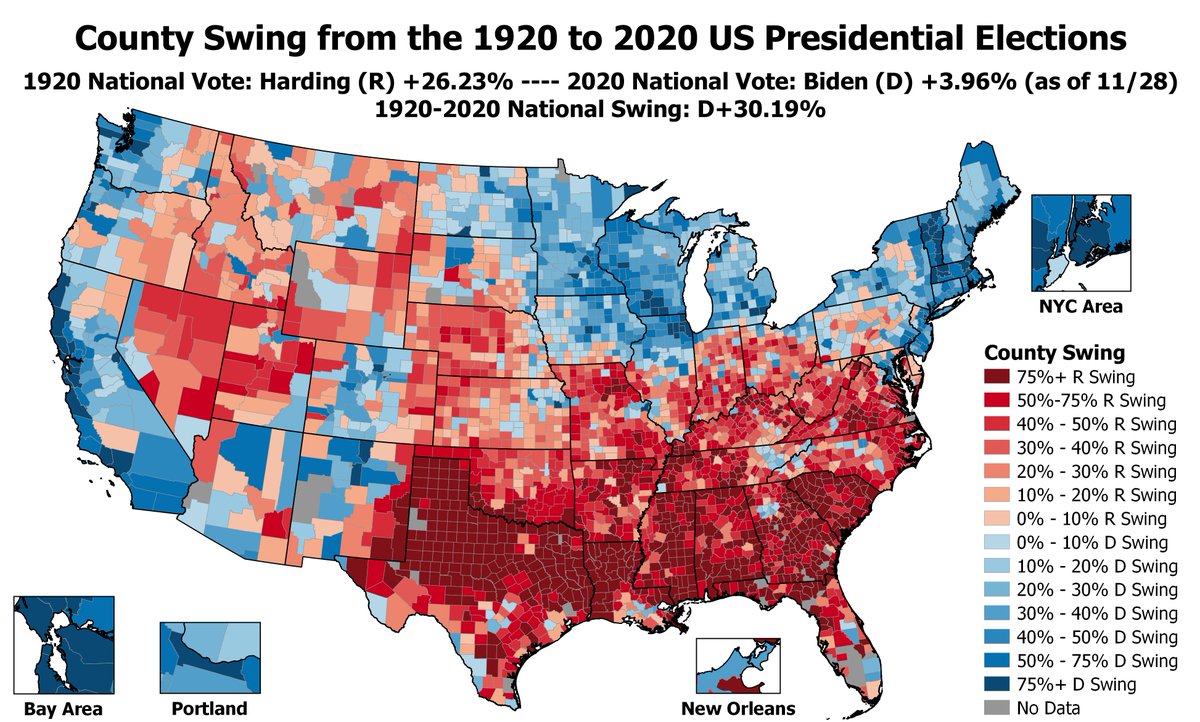
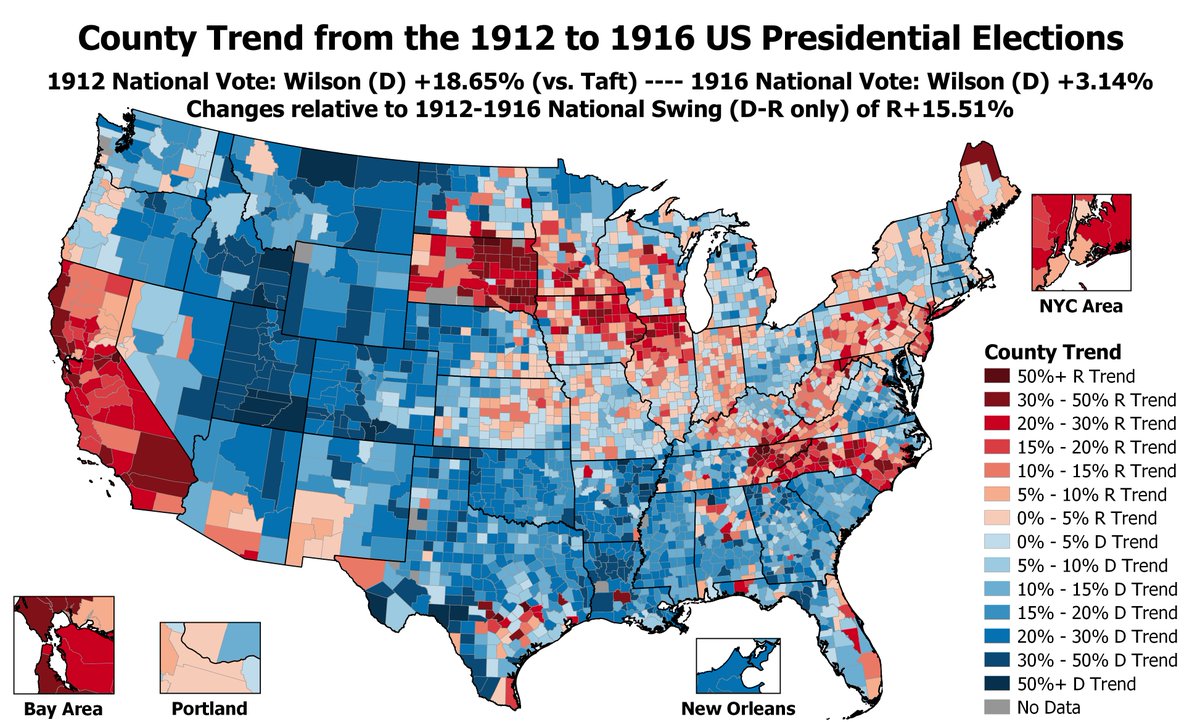
Swing from the 1912 to 1916 elections. Woodrow Wilson (D) was elected in 1912 in a 4-way race, beating Taft (R) by 19 pts (only beat Teddy Roosevelt, who ran as a Progressive, by 14 pts, but this map is looking at the change in the D-R margin) then was re-elected in 1916 by 3 pts
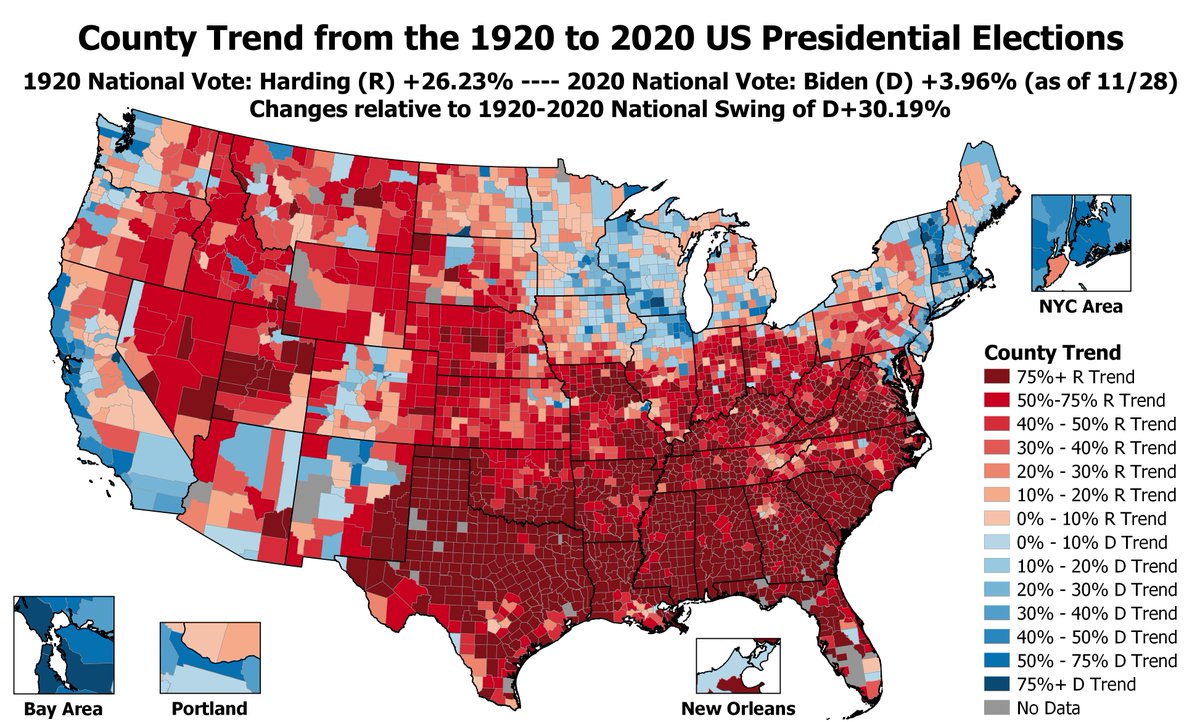
Here is the same map in "trend" form, so changes are RELATIVE to the 15.5 pt swing towards the GOP in the national vote. The South & most of the West trended towards Wilson, tho in CA many voters who had went for TR in 1912 returned to the GOP in 1916, as did many Midwesterners:
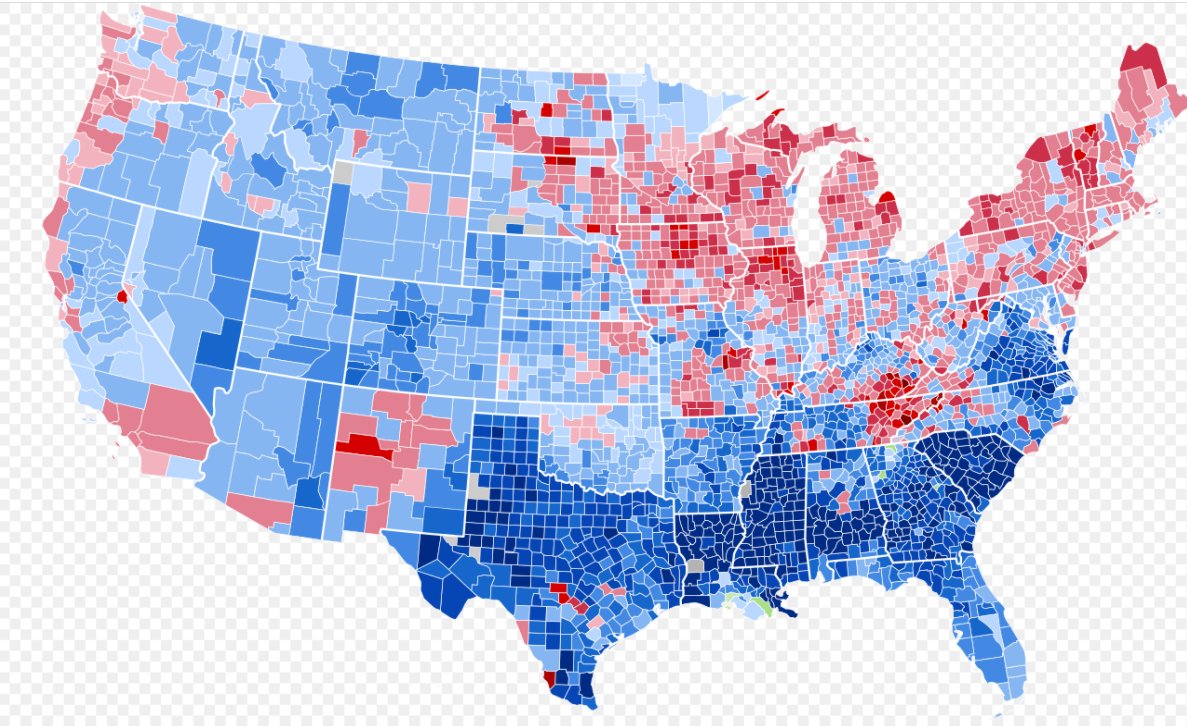
Here are the actual 1912 & 1916 election by county. 1912 was very chaotic, with Roosevelt (Progressive, green) winning many counties & even a few counties being won by Eugene Debs (Socialist, orange). Most of the counties won by Roosevelt went back to the GOP & Hughes (R) in 1916
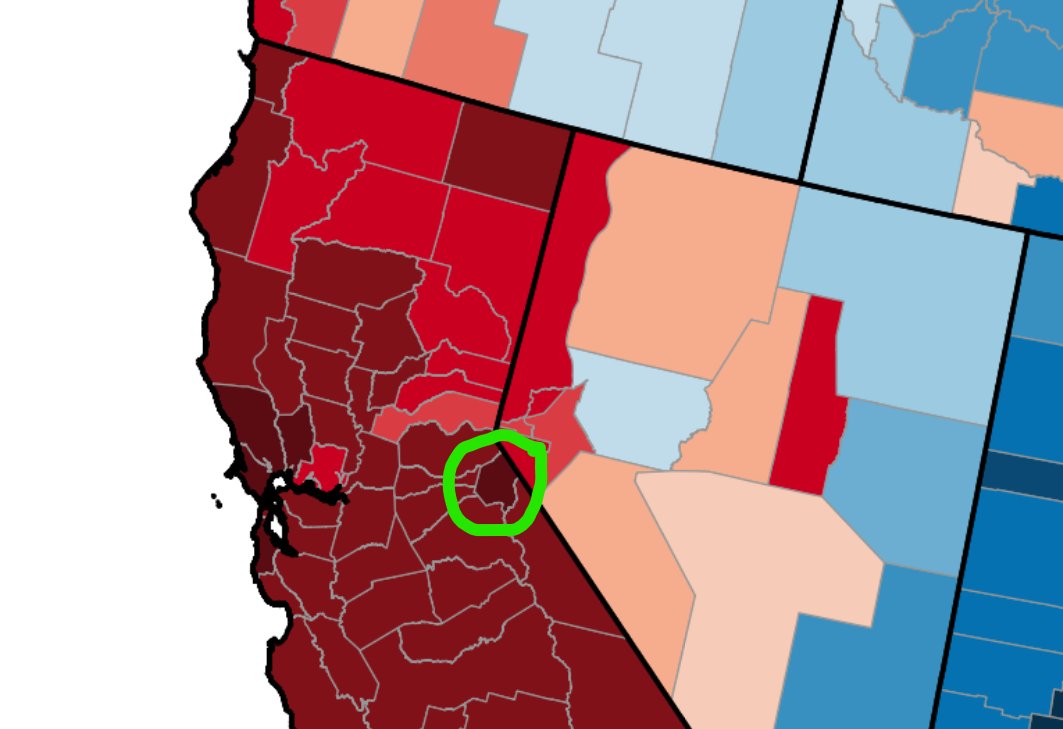
The biggest GOP swing was in Alpine County CA, which went from a 43-10 Wilson (D) margin over Taft (R) in 1912 (Roosevelt [P] won the county with 45%) to a 72-27 Hughes (R) win over Wilson in 1911. Roosevelt endorsed Hughes in 1916, so most of his CA voters returned to the GOP:
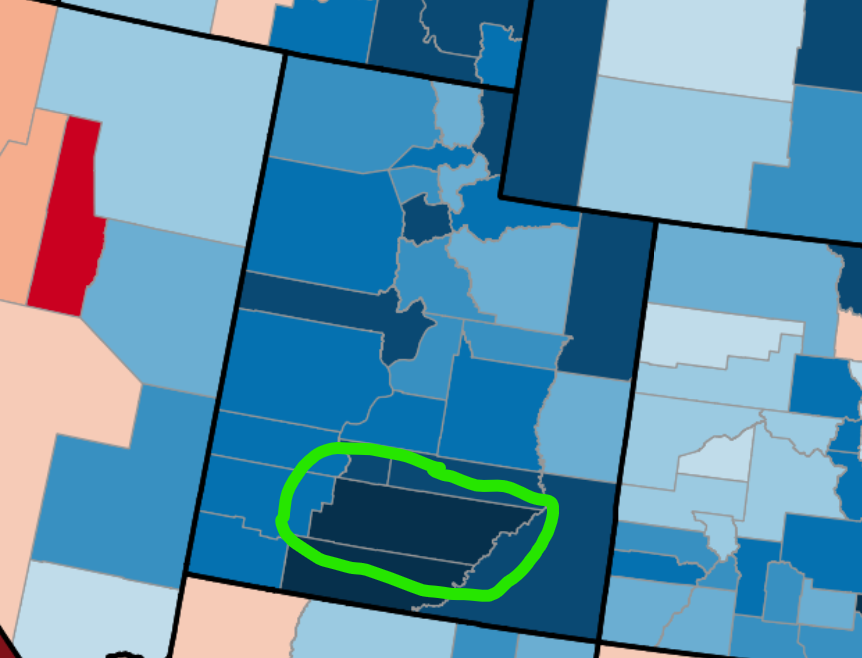
The biggest Dem swing was in Garfield County UT, which went from 63-23 Taft (R) in 1912 to 61-38 Wilson (D) in 1916. Utah saw a big swing towards Wilson, as his progressive policies were popular there & the LDS leadership (which had supported Taft in 1912) stayed neutral in 1916:
• • •
Missing some Tweet in this thread? You can try to
force a refresh
Map of the 100 year swing from the 1920 to 2020 Presidential Elections. In 1920, Harding (R) won a 26 pt landslide, currently Biden (D) is winning by 4 pts, so nationally there was a 30 pt Dem swing over 100 years. GOP gained in most of the South, Dems on the WestCoast/Midwest/NE
Here is the same map in "Trend" form, so county changes are RELATIVE to the large 30 pt Democratic swing nationally. Most urban areas outside the South trended Dem over the past century, while most rural areas have trended GOP, with a few exceptions on the West Coast/Midwest/NE:
Here are the actual county maps from 1920 & 2020 (maps from Wikipedia). In 1920 almost all the counties won by Cox (D) were in the South, while in 2020 Biden won pockets/stretches of counties in all different regions of the country, with most rural counties going to Trump.
Thread on the Exodusters, a group of African-American refugees who fled the end of Reconstruction in the South & moved to the "Promised Land" of Kansas in 1879 & 1880. They contributed to an increase in the African-American population of KS from 17,108 in 1870 to 43,107 in 1880:
Despite the increase of 25,999 African-Americans in KS, the % of the KS population that was African-American actually fell slightly, from 4.7% in 1870 to only 4.3% in 1880. This was because the White population of KS absolutely exploded, from 346,377 in 1870 to 952,155 in 1880!:
Many Exodusters migrated from Louisiana, where political violence was unbearable in the aftermath of the Compromise of 1877. Federal troops had been withdrawn, & paramilitary groups like the "White League" were attacking the Black population & suppressing the vote with impunity:
#ElectionTwitter Thread: Map of the county swing from the 1936 to 1940 Presidential Elections. FDR was running for an unprecedented 3rd term & did 14.3 pts worse than in 1936, with big losses in heavily German-American areas like the Midwest & Great Plains, in the run-up to WW2:
Here's the same map in Trend form, so county swings are relative to the 14 pt national swing towards the GOP. Much of the NE & South trended towards FDR. Along with German-Americans, FDR had defections from some Italian & Irish voters, contributing to losses in urban areas (NYC):
Maps of the actual 1936 & 1940 elections from Wikipedia. GOP nominee Alf Landon had been blown out by FDR in 1936, only winning a smattering of counties across the country, but Wendell Wilkie was much more competitive in 1940, winning wide swathes of the rural heartland of the US
Got lost in the shuffle a bit, but Trump ended up winning the single Electoral Vote from Maine's 2nd District pretty easily, by 7.9 pts! He won it by 10.3 pts in 2016, so Biden gained 2.4 pts. Maine as a whole went from a 2.9 pt Clinton win to a 10.1 pt Biden win, a 7.2 pt swing.
FiveThirtyEight had Biden actually favored to carry the district, with 7 of the last 8 polls favoring Biden, so this was one of the biggest misses of the cycle. Their overall Maine forecast wasn't far off though, projecting an 11.8 pt Biden win in Maine vs the actual 10.1 pt win.
On the other hand, FiveThirtyEight actually UNDERESTIMATED Biden in the 1st District of ME, thinking he would win by only 21 pts while he is currently leading by 22.7 pts. This pattern mirrors the nation: Biden was underestimated in blue areas like CA & overestimated in red areas
I'm assuming this is a reference to beautiful Supai, on the Havasupai Reservation, AZ. Supai is 8 miles from the nearest road, only accessible by foot, helicopter, or mule. I had never considered the concept of mule-in ballots from there tho:
Supai is located in Cataract Canyon, the largest side-canyon of the Grand Canyon. Havasu creek runs through the canyon on the way to the Colorado River, it is aquamarine in color due to the presence of calcium carbonate in the travertine deposits that line the creek.
Supai AZ has been referred to as "the most remote community" in the contiguous United States by the U.S. Department of Agriculture. Here is a mule train from Supai carrying US Postal Service boxes, I assume this is how ballots would be mailed to & returned from the voters there:
#ElectionTwitter Map of which Democratic Presidential Candidate got the highest % of the vote in each county, from 1972-2016. Carter's run in 1976 (colored red) achieved the highest Democratic % in the most counties, 2,010 in total, many in areas that are very conservative today.
If we focus on the modern Dem coalition by taking out Carter's runs, most counties highest Dem % comes from one of: Obama's run in 2008 (which did well in more liberal areas), Clinton's runs in 1992/1996 (strong in the South), & Dukakis' run in 1988 (areas hit by the Farm Crisis)
Here's the best performing Democratic Presidential Candidate by State from 1972-2016. Carter's run in 1976 & Obama's 2008/2012 runs achieved the highest Democratic % in the most states, except for: CA (Clinton 2016), MA (Kerry 2004), AZ/LA (Clinton 1996), & IA (Dukakis 1988).