UPDATE: A cautious estimate of the number of excess UK deaths linked to coronavirus since mid march has passed a new marker and stands at
80,100
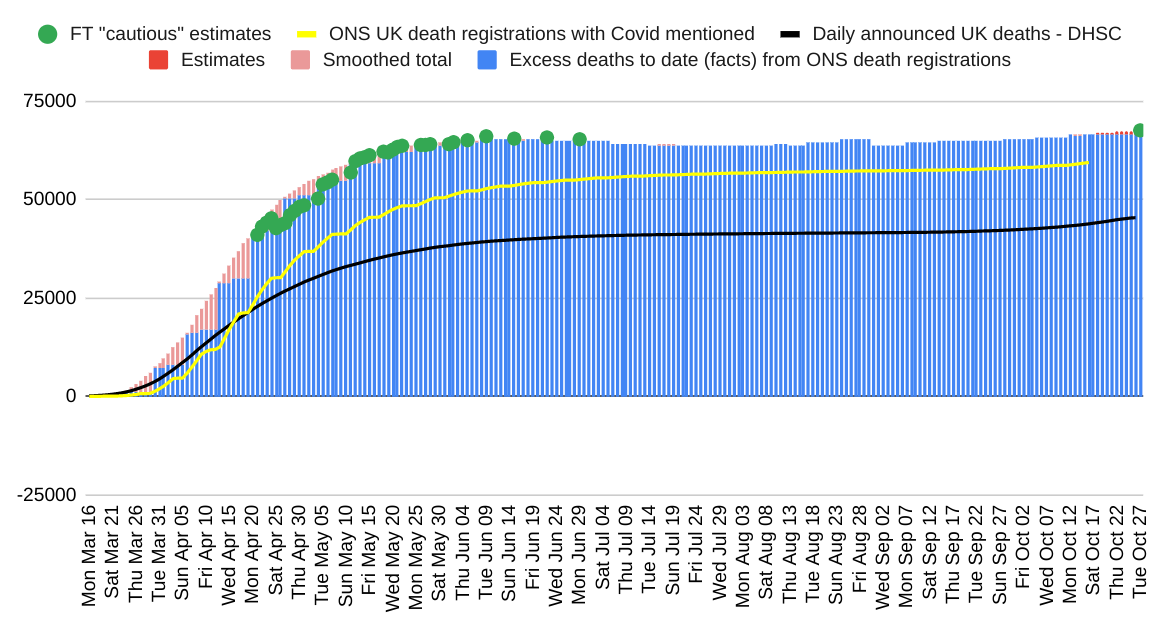
Of these 75,200 have happened and the rest are estimates bringing lagged official data up to date
1/
When measured properly, it is clear that the second wave has been far less deadly than the first.
My estimates suggest that excess deaths are now beginning to decline
2/
Why should you believe these numbers?
a) Because the updating model is proving remarkably accurate in the second wave (I'm surprised how accurate)
b) This welcome feature stems from better Covid testing, so daily hospital deaths pick up roughly all excess deaths this time
3/
FWIW - an extremely speculative* estimate of the R number based on my excess deaths series suggests it was hovering around 1 just before lockdown and persistently went below 1 after Nov 2nd start of lockdown
* Total back of the fag packet - don't take too seriously
ENDS
• • •
Missing some Tweet in this thread? You can try to
force a refresh
After today's official figures on excess all cause mortality up to 6 Nov, my estimate of the current total of excess UK deaths linked to coronavirus stands at
75,000
Of these deaths, 70,528 have already happened. The rest are estimates to bring the data up to date
1/
While all cause mortality does not tell us exactly why people died, the figures are rising slower than deaths which doctors directly attribute to Covid-19 (not much, but a little)
And they are happening in the areas with high Covid-19 caseloads.
2/
Doctors certificates and regional correlations with the disease incidence (both in the sping and now) should be enough to convince rational people that the cause is Covid-19.
To argue otherwise requires quite some contrary evidence.
3/
No death is ever good news, but the relatively low number (996) excess deaths in England & Wales over the most recent week suggests the number of deaths linked to coronavirus since the pandemic began is around
72,300
1/
There is now no doubt that the second wave is very different to the first.
In England & Wales, excess deaths have been in Covid hotspots so clearly linked, but have been running lower than the govt's deaths within 28 days of a test.
In the spring they were double
2/
The deaths in the most recent week of ONS data were people infected around the start of October, so there are unfortunately likely to be further increases to come in the weeks ahead..
Case numbers are high across the UK and again much higher when people are tested randomly than when they go for tests, but it's still nothing like the case estimates of the spring
2/
Borrowing from economics, where we also have to be careful about measurement error and out-of-date data, hospitalisations and deaths are not following the patterns of the spring.
So far, excess deaths this time are in line with recorded daily deaths, for example
.... and why this is bad news for the measured productivity of lawyers and management consultants
but good news for telecoms companies
1/
The ONS today published its first estimates of UK GDP volumne based on double deflation (ie you measure the volume of inputs for each industry and outputs)
Doesn't make much difference to overall GDP trends, but it does to industry controibutions
But the big change - which has been flagged for over 2 years is that the ONS has been underestimating the output of the telecoms industry significantly because it did not recognise how much output prices have fallen
Update: Sadly, UK excess deaths are rising again after a summer of stability. Since mid-March, a cautious estimate of the number of UK excess deaths linked to coronavirus has risen to
67,500
There is both bad and good news in this figure
1/
The bad news first:
- The numbers are rising again. Office for National Statistics reported 669 excess deaths in England and Wales in the week to 16 Oct - 6.8% above the five year average
- There was not much of a decline in excess deaths over the summer. Almost zero
2/
That is pretty strong evidence that the deaths in the spring were not simply of people who had weeks or months to live
- The excess deaths in mid-October reflect infections towards the end of September, which have roughly trippled since,
3/