⚡️ NEW STUDY RELEASE (9:30 ET 12/1) ⚡️
Why Local Solar For All Costs Less:
A New Roadmap for the Lowest Cost Grid
A thread 🧵 - this study has been ~18 months in the making! @SolarAccess @Sunrun @TeamKivvit @LocalSolar4All @votesolar @DrChrisClack @achoukulkar @RabagoEnergy
Why Local Solar For All Costs Less:
A New Roadmap for the Lowest Cost Grid
A thread 🧵 - this study has been ~18 months in the making! @SolarAccess @Sunrun @TeamKivvit @LocalSolar4All @votesolar @DrChrisClack @achoukulkar @RabagoEnergy

Executive Summary: vibrantcleanenergy.com/wp-content/upl…
PPT White Paper: vibrantcleanenergy.com/wp-content/upl…
Press Release: vibrantcleanenergy.com/wp-content/upl…
Summary Spreadsheet: vibrantcleanenergy.com/wp-content/upl…
PPT White Paper: vibrantcleanenergy.com/wp-content/upl…
Press Release: vibrantcleanenergy.com/wp-content/upl…
Summary Spreadsheet: vibrantcleanenergy.com/wp-content/upl…
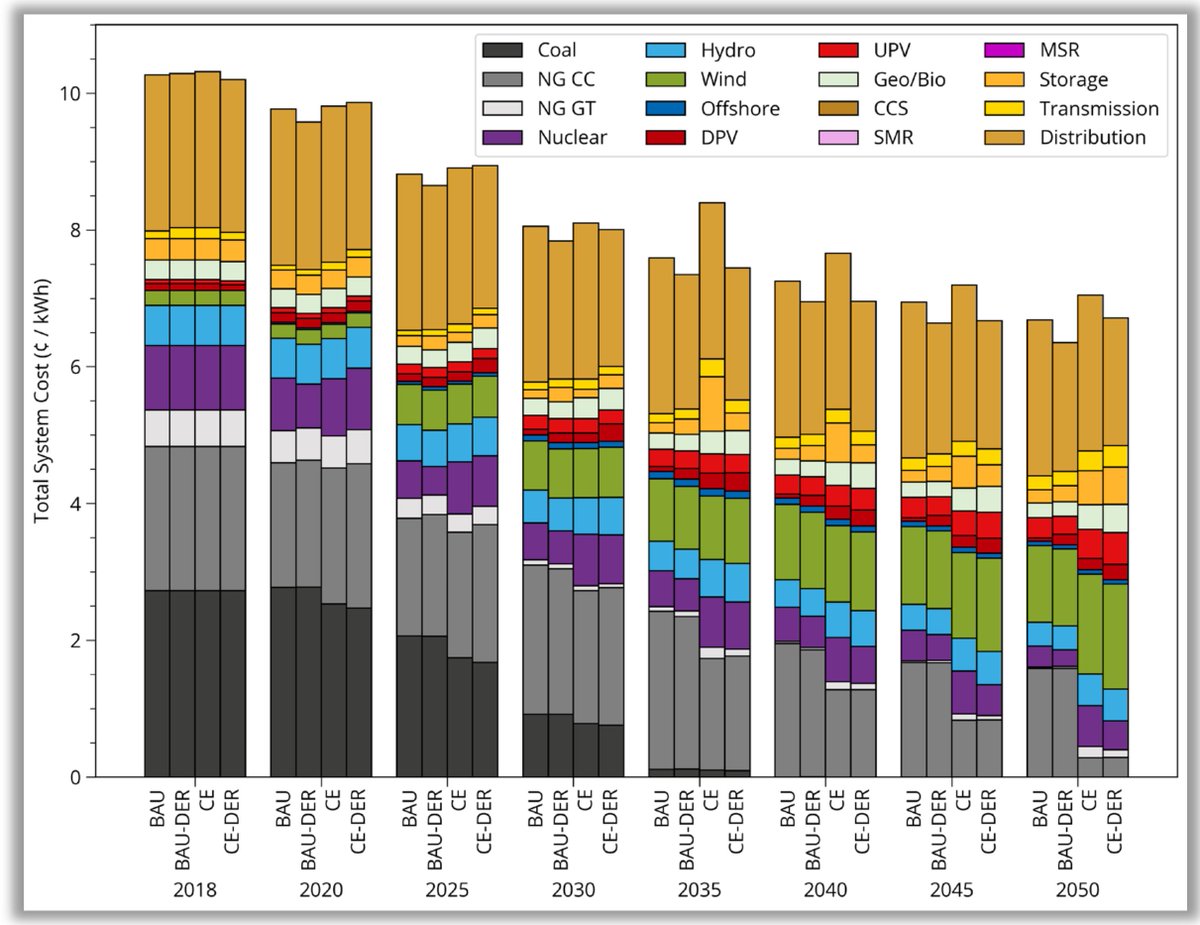
We present four (of our 15) scenarios that show what DERs can do under BAU and a nationwide CES. We augmented our WIS:dom®-P modeling software during the course of the study to better represent the distribution grid. We did this using an interface (or event horizon)

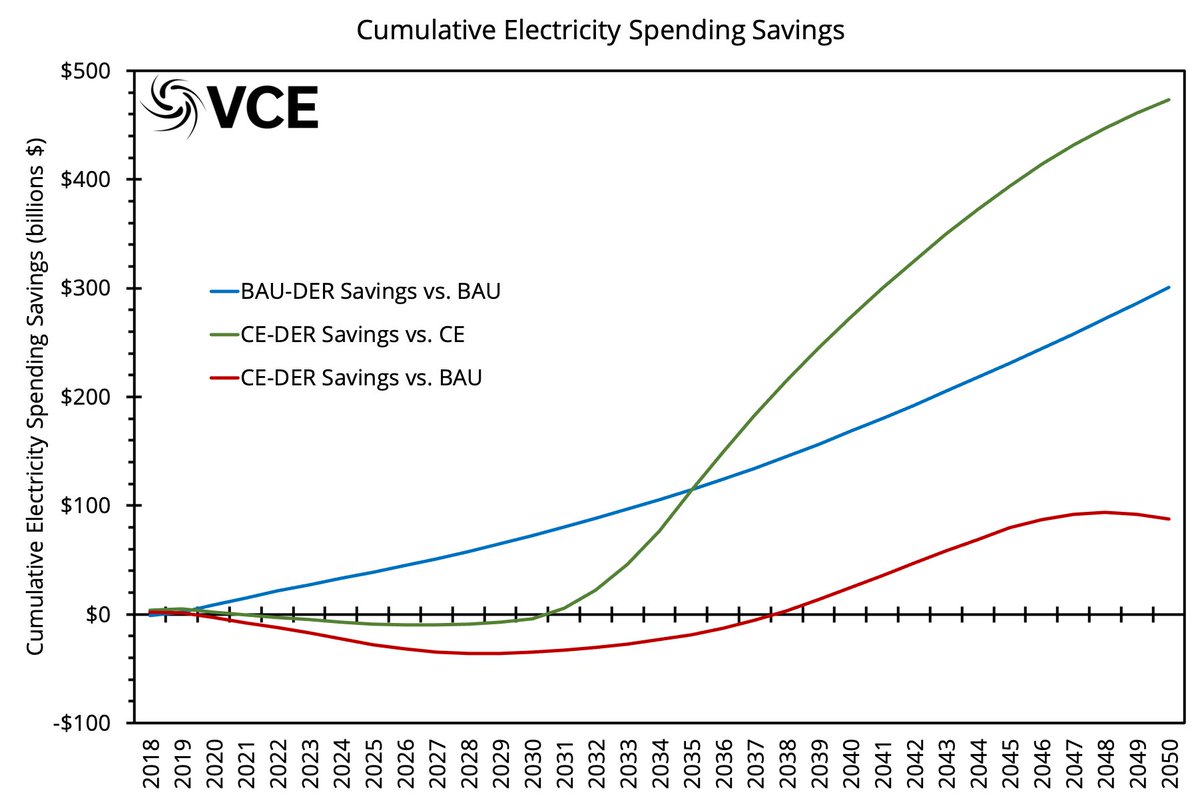
We found that by incorporating data about the distr. system (as part of co-optimization) that we can save as a nation BILLIONS of dollars AND clean the elec. sector. In fact, we wld spend nearly half a TRILLION by 2050 MORE for a clean elec. system w/o distr. co-optimization.

Further, the BAU is $88 BILLION MORE expensive than the CE-DER (clean elec. with distr. co-optimization). That means that a clean grid could be cheaper than the traditional view of BAU through 2050.
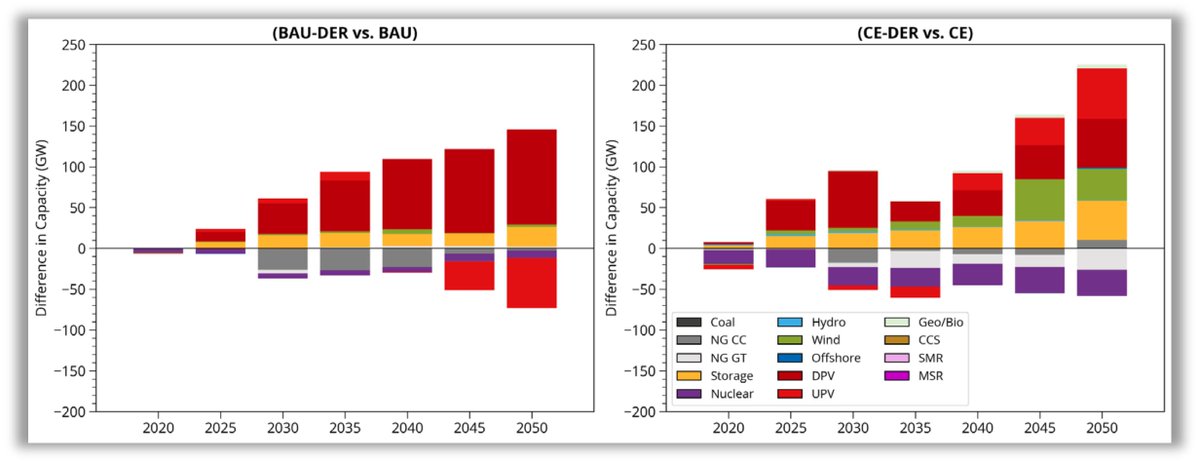
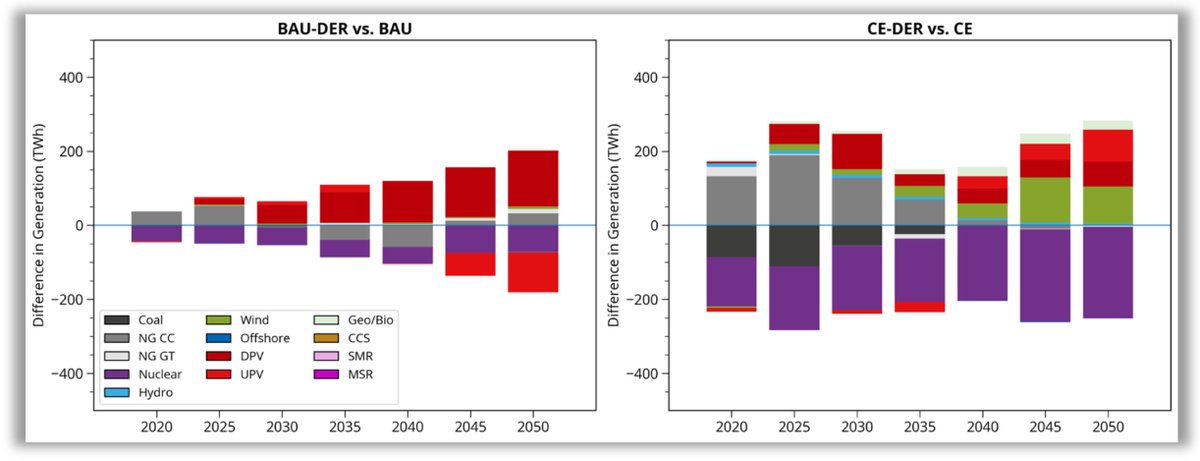
Will this require completely changing the build out of generation? Well, no not really. We need more local solar and storage, but the installed capacities are largely the same; and some scenarios show more VRE on the utility grid, too. Generation is only slightly altered as well.
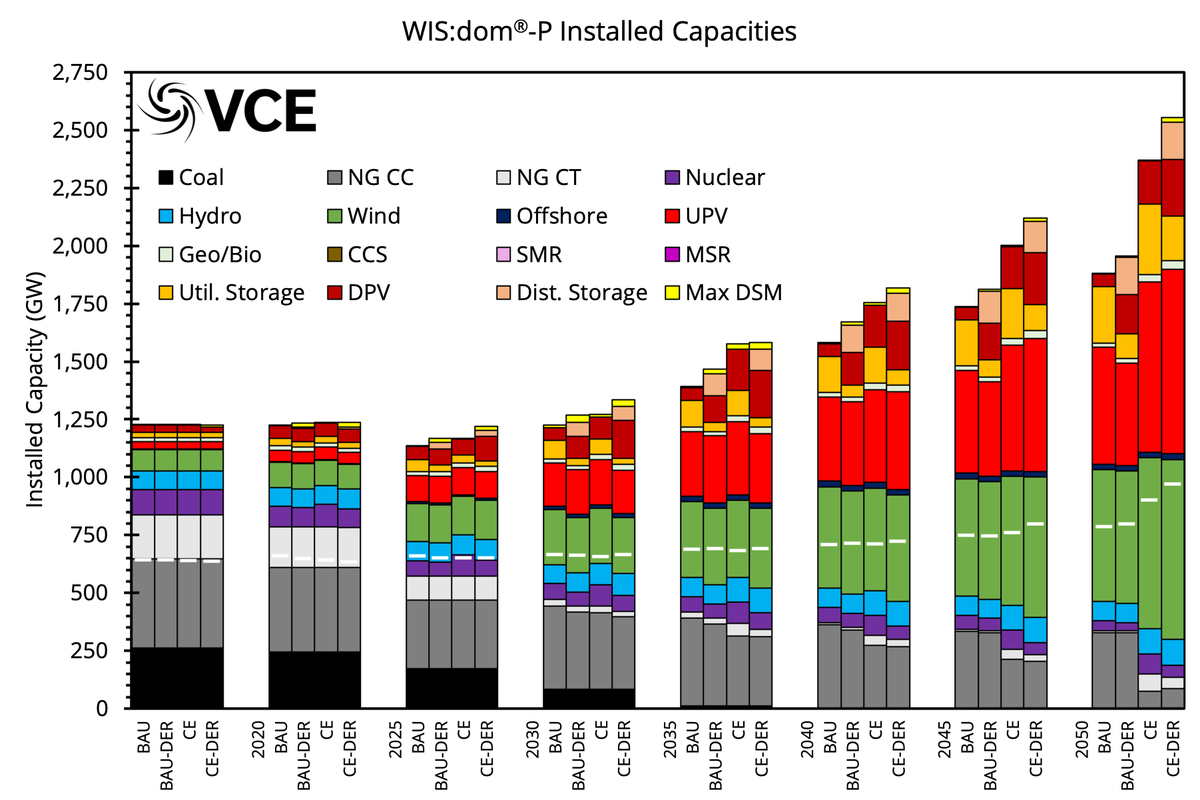

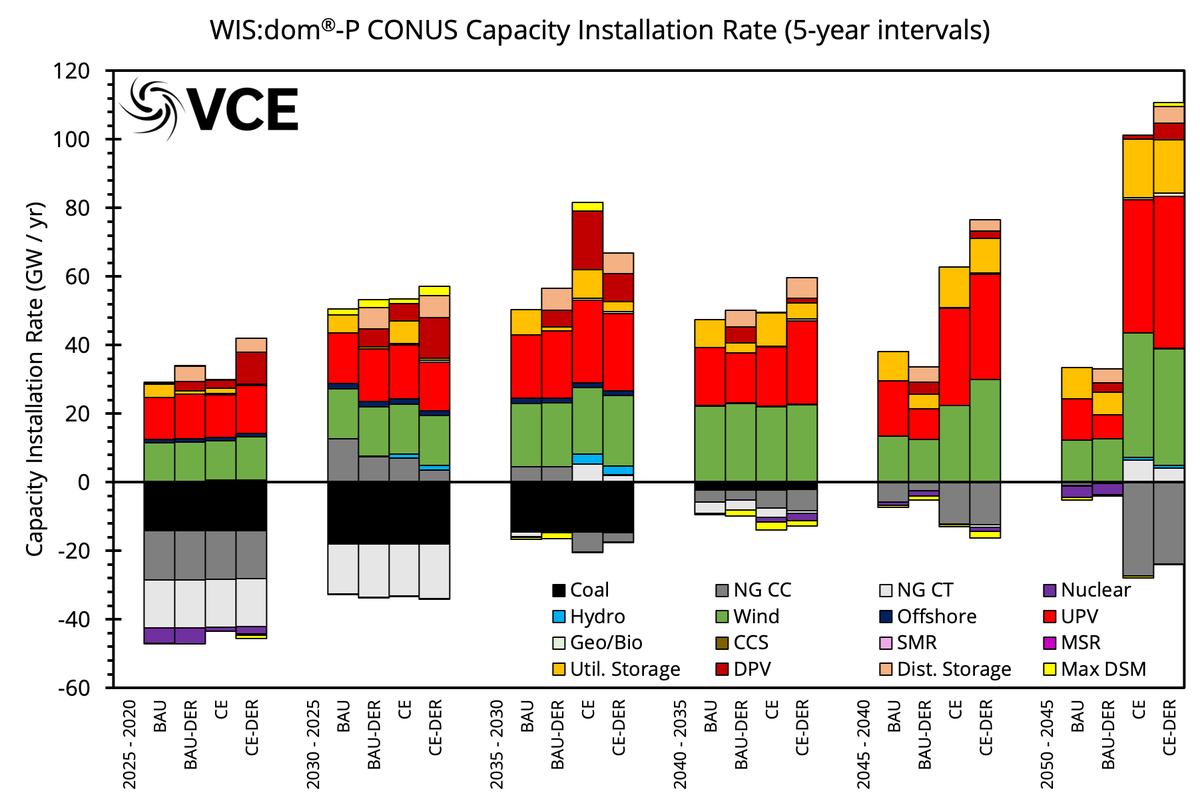
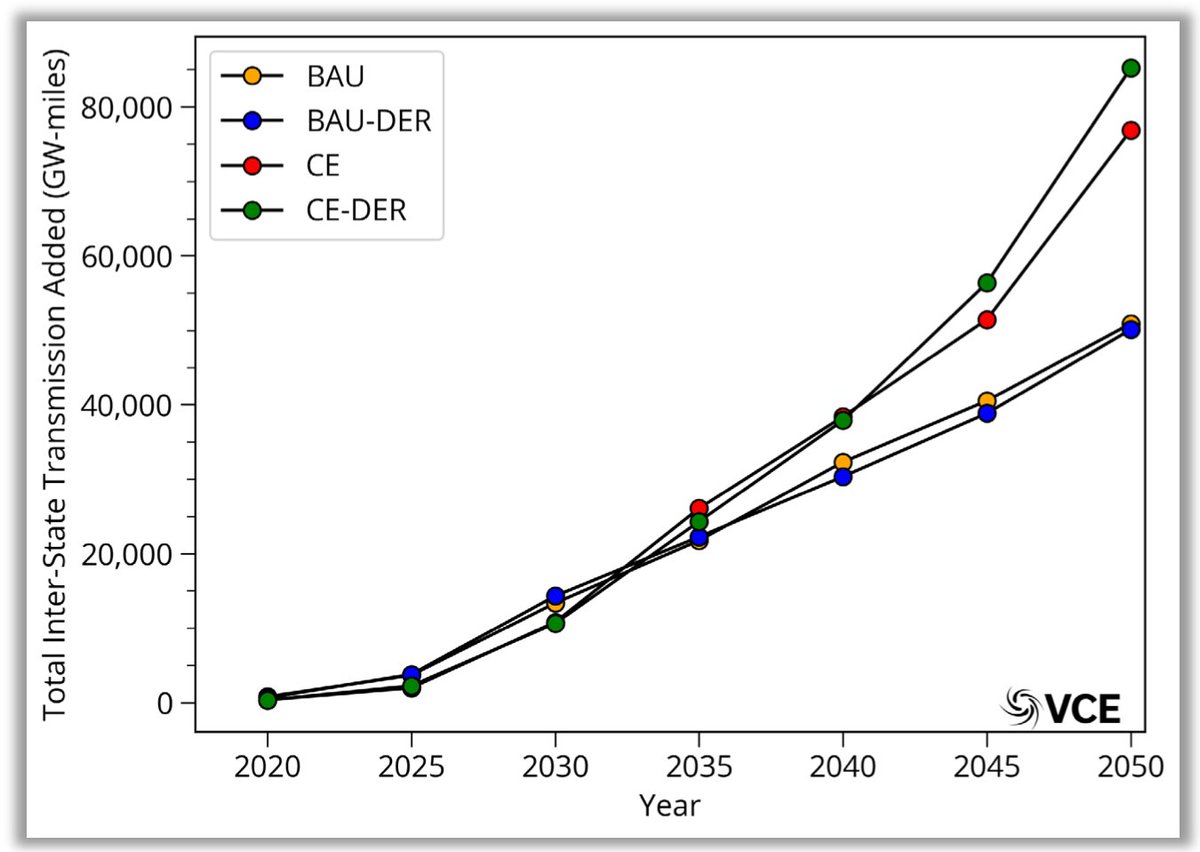
Moreover, the distribution co-optimized scenarios have a smoother installation rate increase over time than the other scenarios. This means that factories and industries should be able to keep up. Notice that all coal is GONE by 2035 in all four scenarios! BUH-BYE
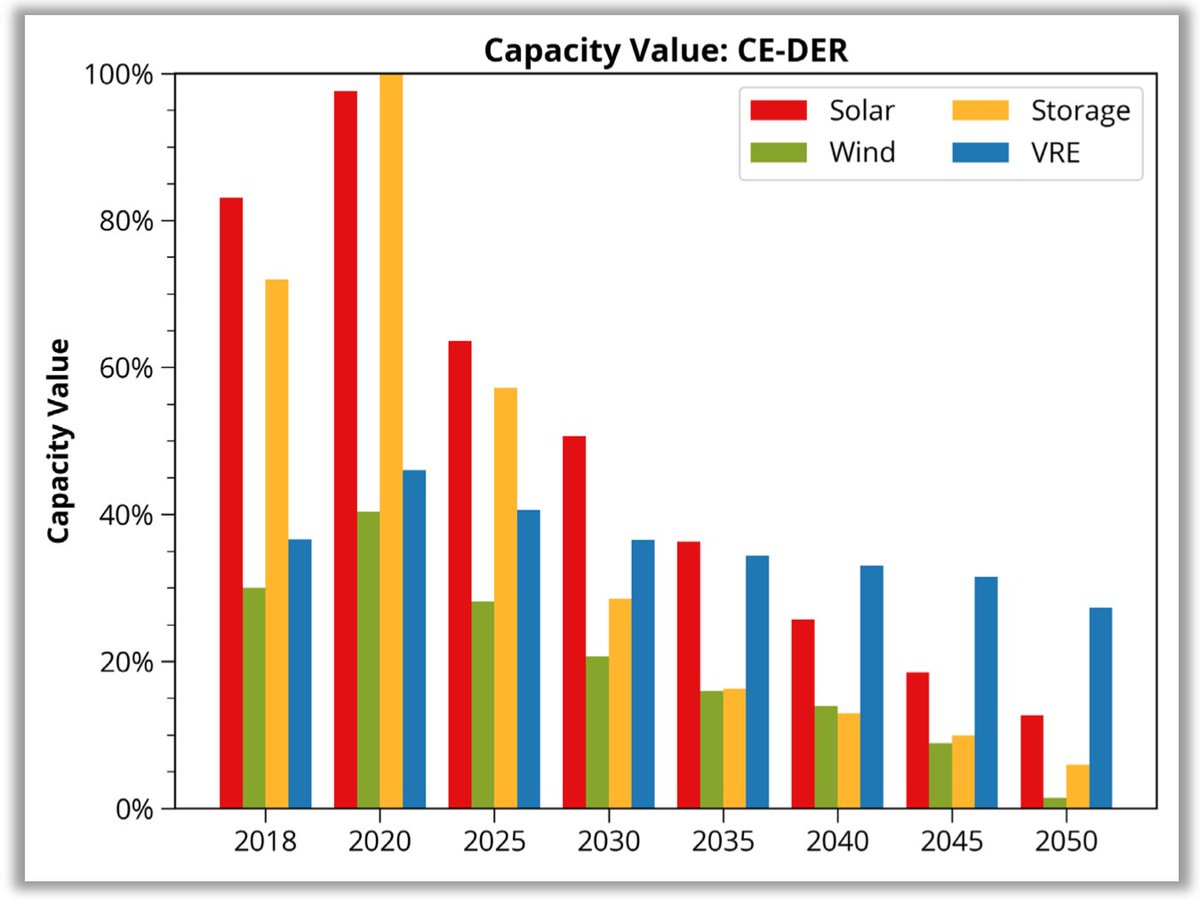
How does such a little change in installed capacity lead to dramatic alterations in spending? This is because the model can determine the value of the distribution resources and essentially shift demand to meet utility-scale demand more efficiently through local solar and storage


With solar and storage locally shifting and reshaping the demand observed by the utilities, these assets can be utilized more efficiently and cost effectively. The distribution assets can also reduce grid edge spending by producing more locally.


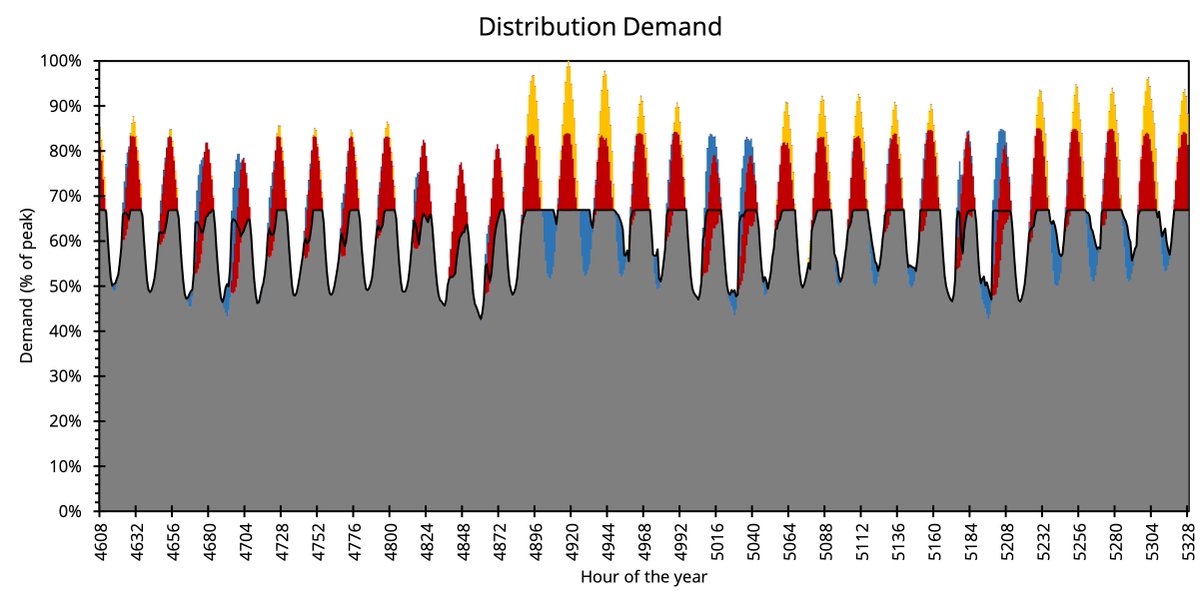

The result is a load duration curve that reduces the coincident peak across the US by over 16%, and keeps the peaks down by 10% for over 80% of the year. It then increases the troughs by 10% to increase utilization. The tails of the distributions provide huge cost savings.


This change seeps into the retail rates as well. These distribution assets are all assumed to be owned by the profit seeking entities and are incorporated in the system costs. Therefore, it is likely the savings could be higher depending on the ownership types
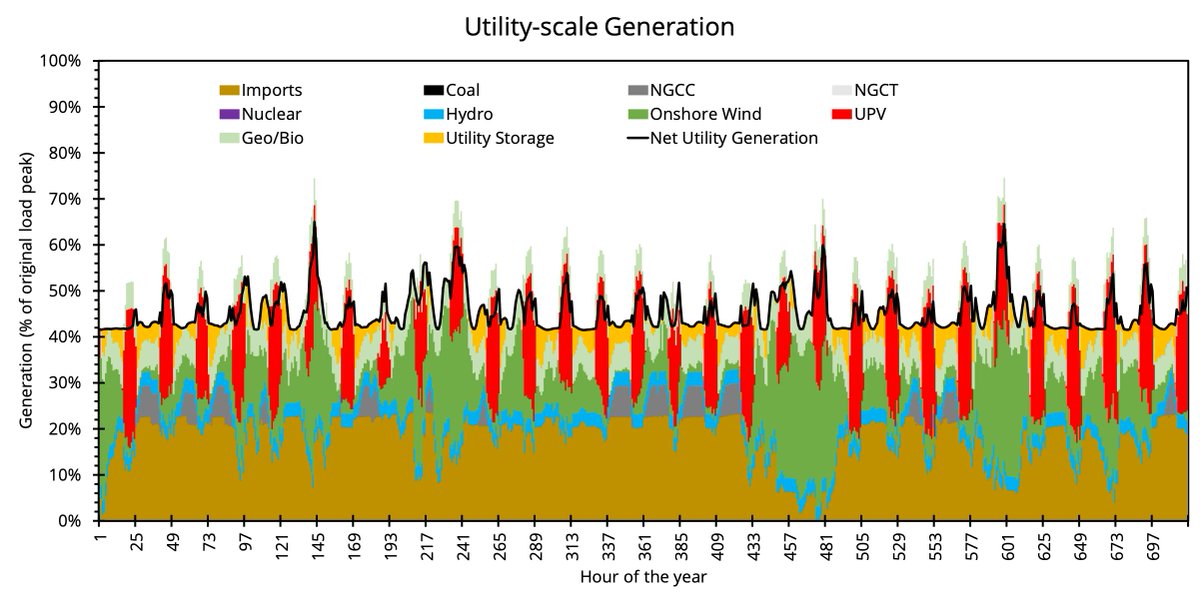
Generation changes dramatically between the BAU scenario and the CE-DER scenario. The WIS:dom®-P model ensures reliability for each 5-minute time period across the entire US. It does this in drastically different ways in the different scenarios.


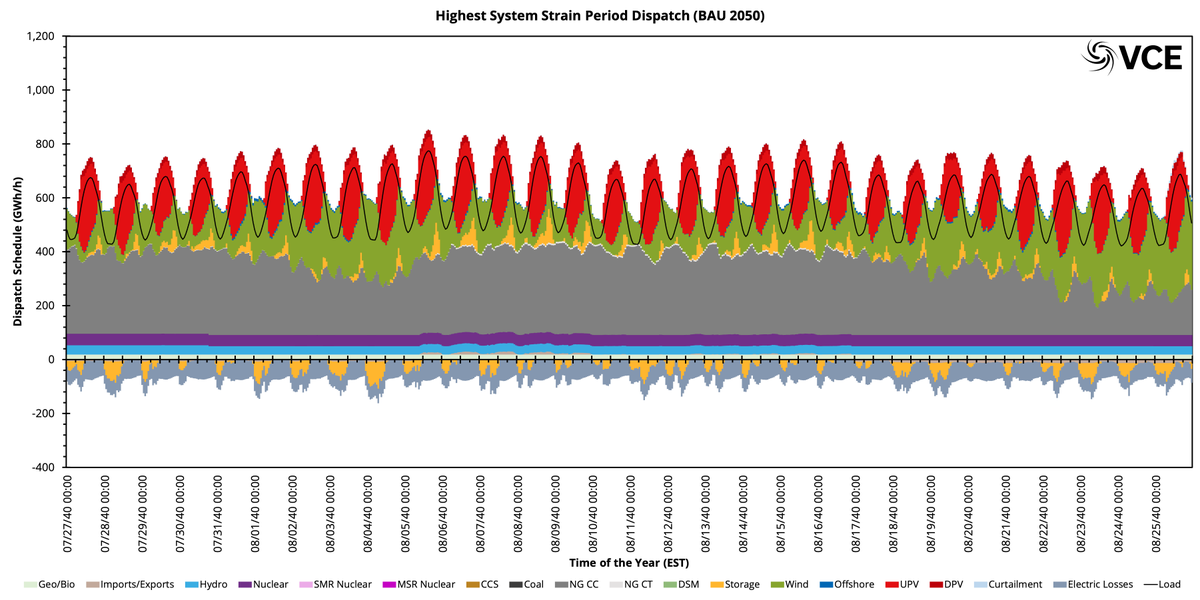
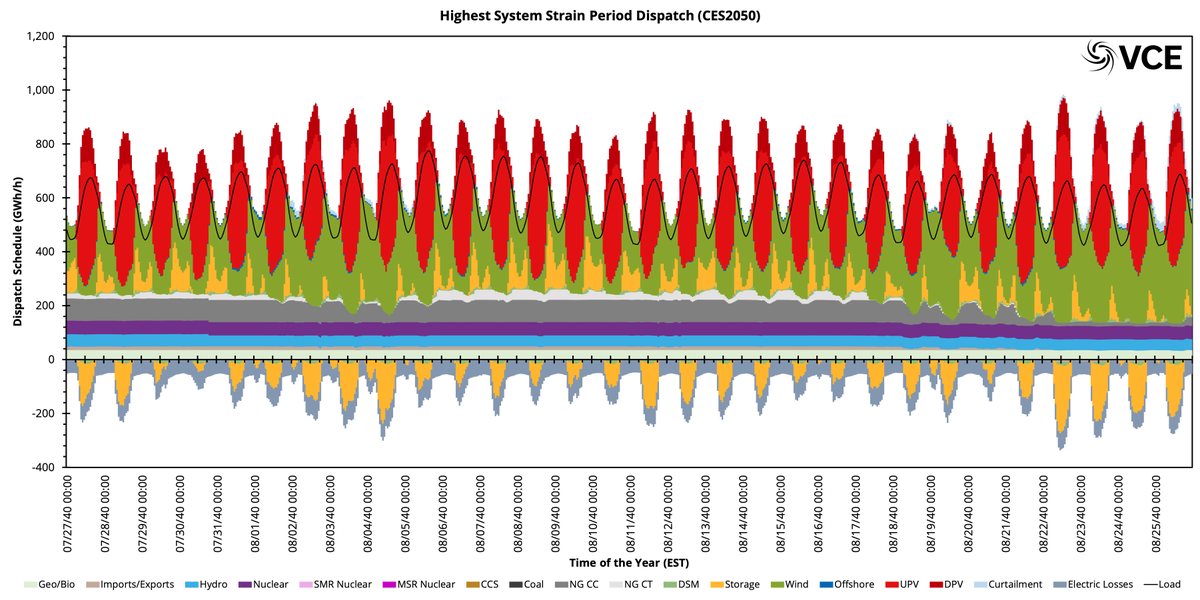
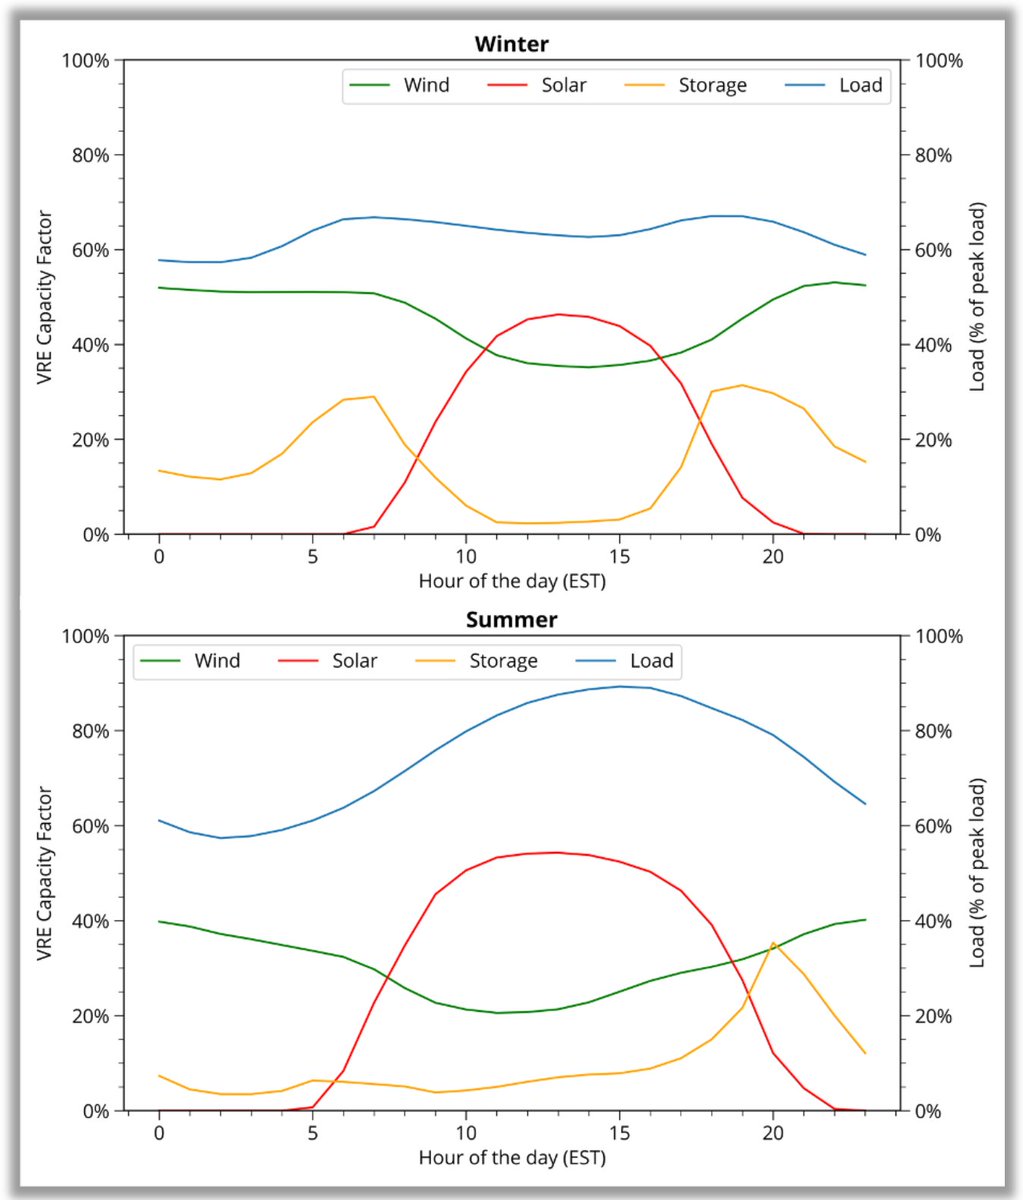
The WIS:dom®-P model includes DSM, EV charging, DR, EE, and other demand services; but the solar and storage within the distribution grid performs the majority of the demand shifting without customer interactions. We can extract many metrics from the model regarding reliability
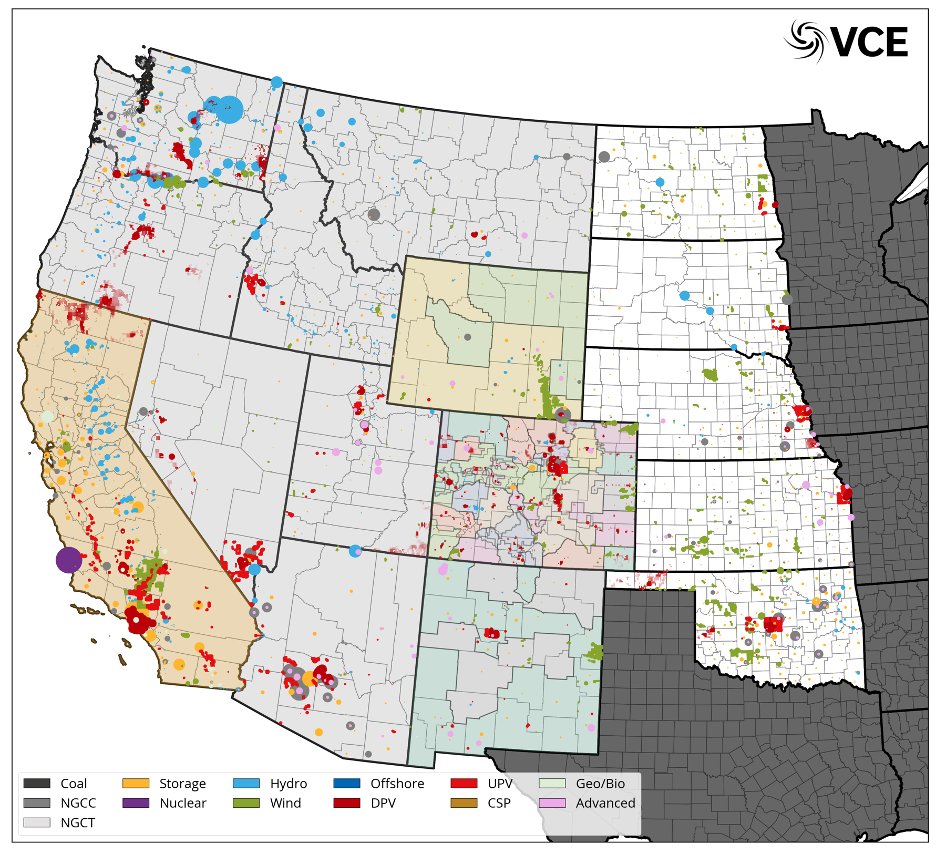
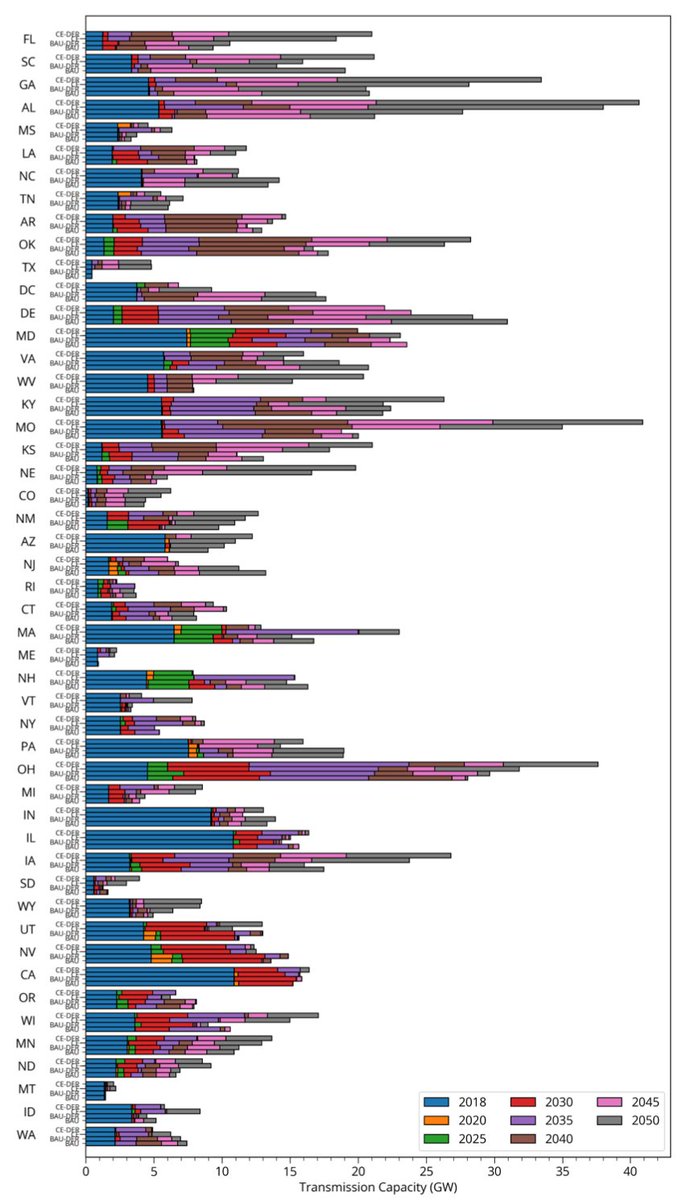
The model sites the generators at a 3-km resolution. It also determines the transmission requirements simultaneously.

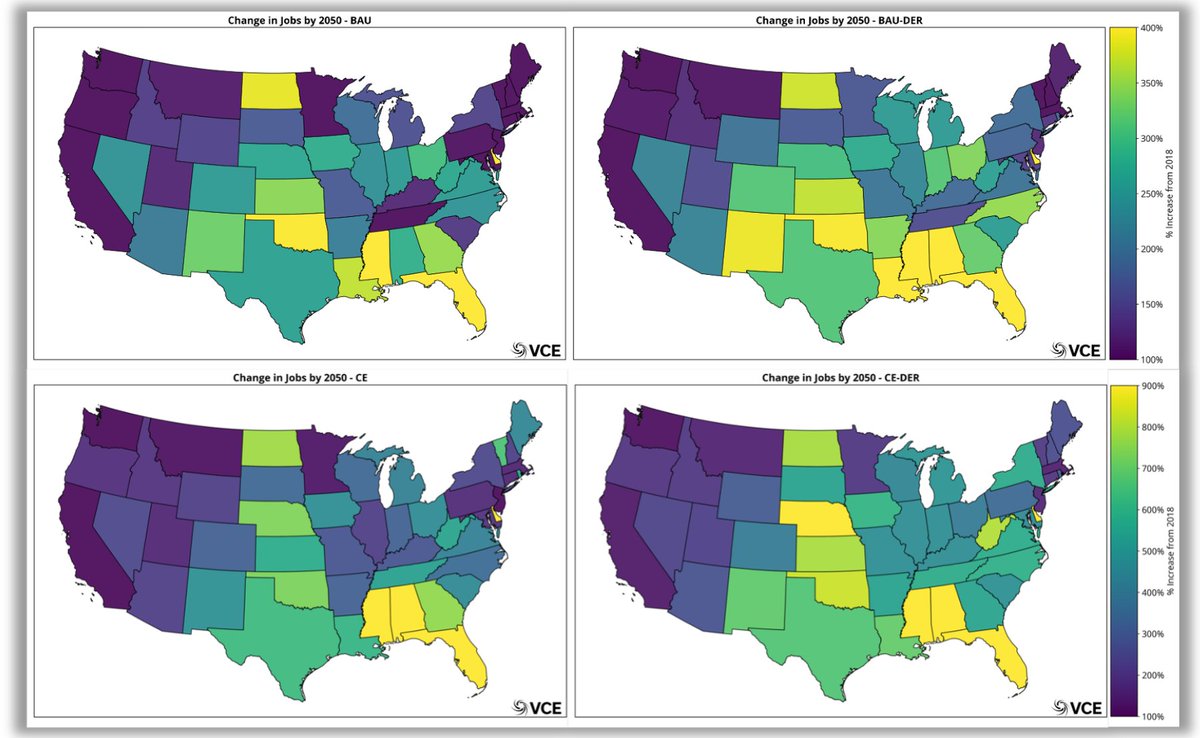
The changing electricity mix increases jobs and there are more jobs with the distribution co-optimization enabled scenarios. The most jobs are in the CE-DER. This means that a clean grid provides more jobs, and is lower cost than BAU. If we include local resources.

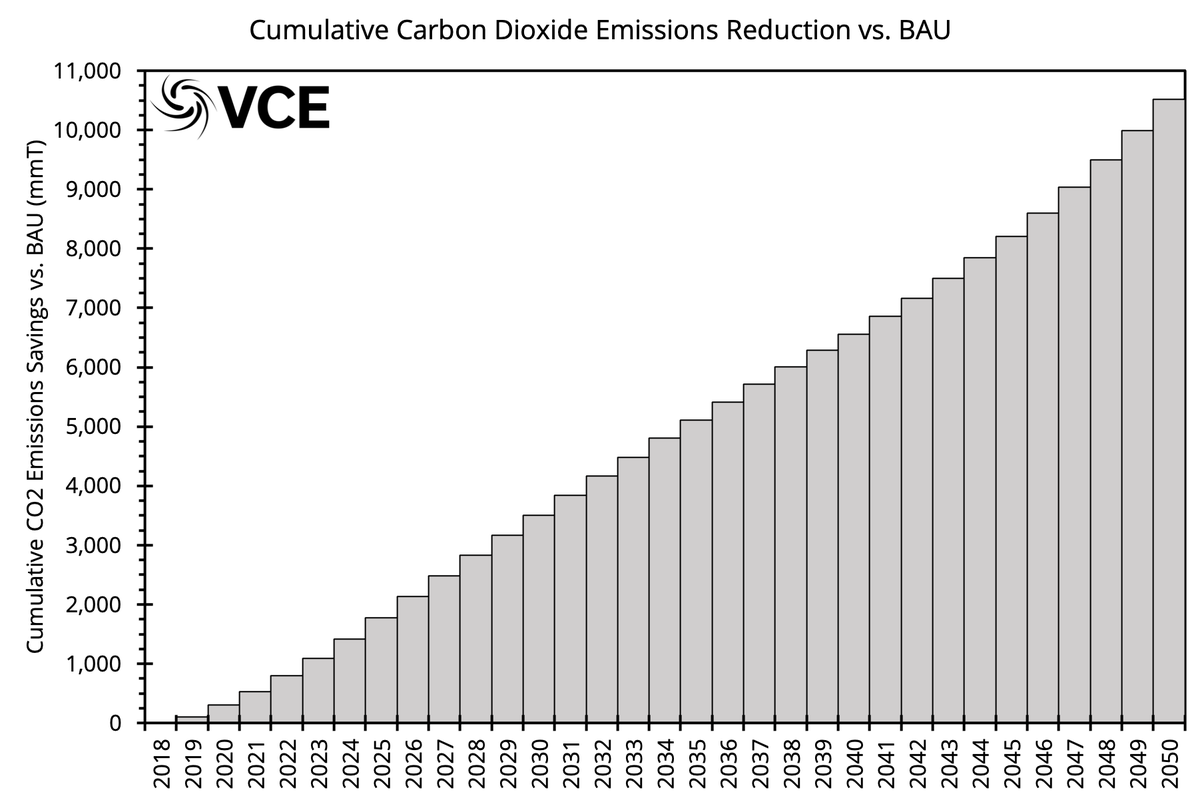
Carbon dioxide emissions are similar with and without distribution co-optimization. With the co-optimization with slightly lower emissions. The CES scenarios result in 10,000 mmT of avoided emissions compared with the BAU.

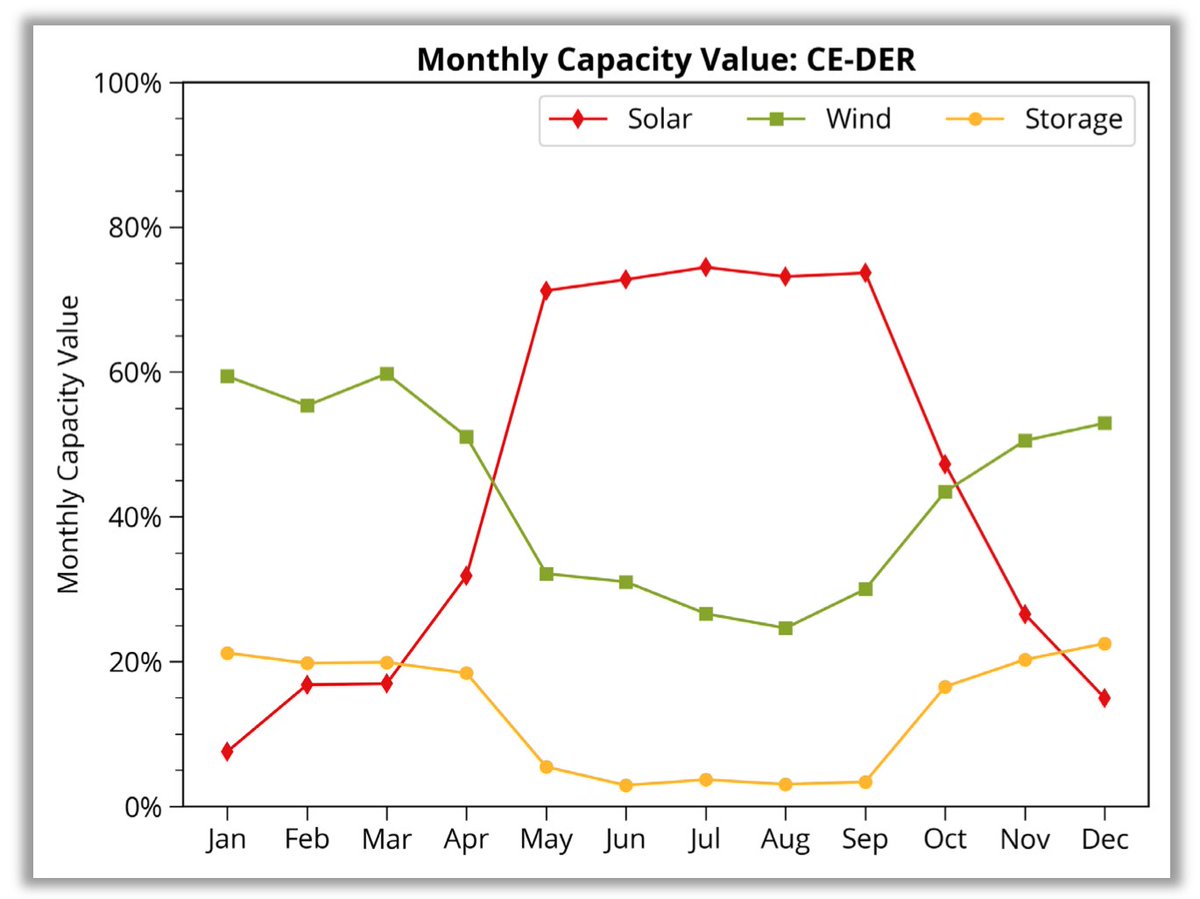
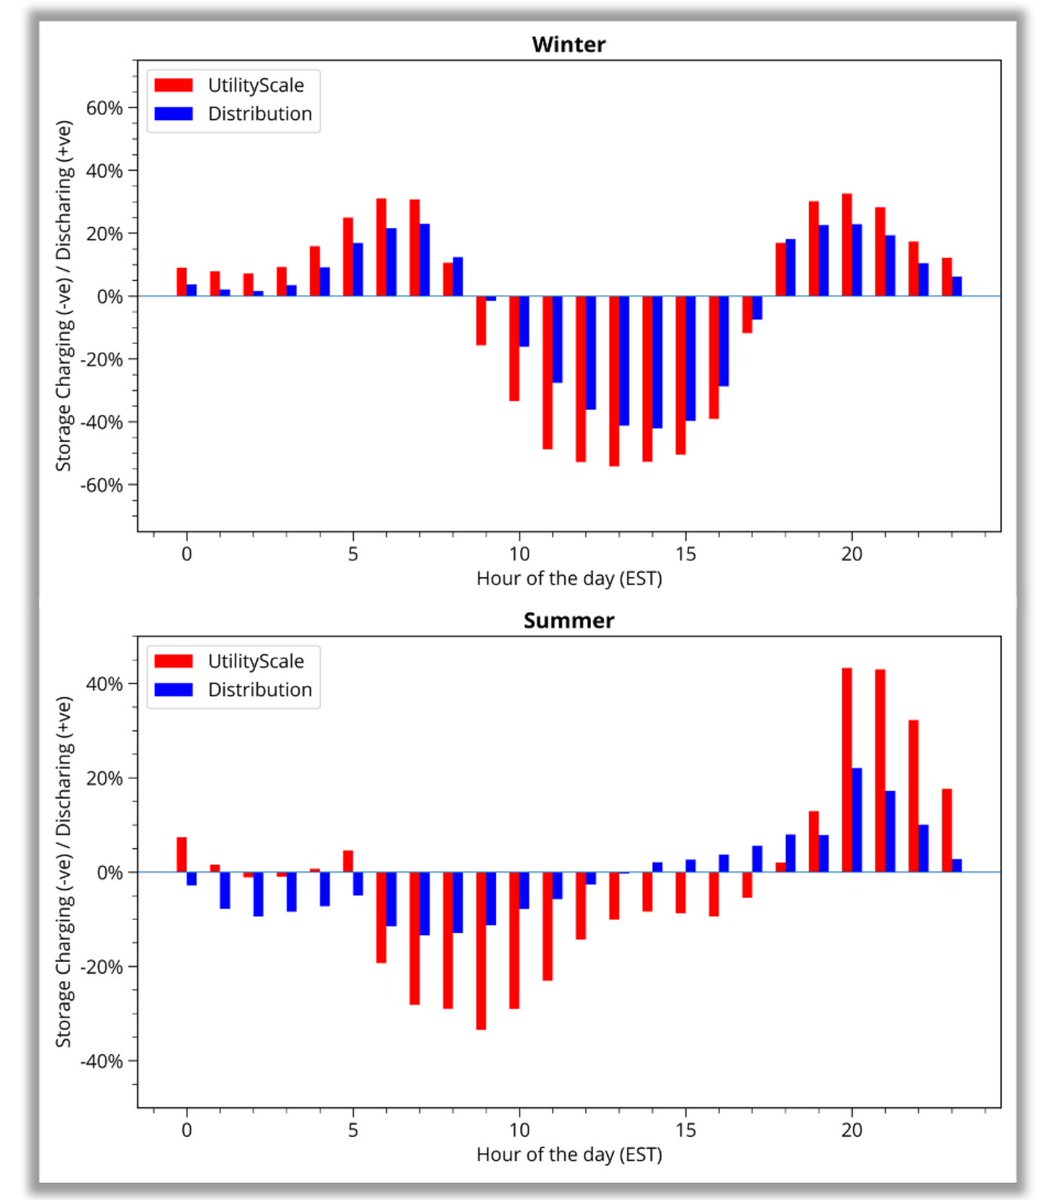
Storage (both utility and distributed) is important and it acts differently to the simple arbitrage behavior we might expect today. The distributed storage acts independently and differently to the utility scale. The report details it more.
To do the study, we used as much publicly available data as possible and documented it in the report. The main cost inputs are from @NREL, while the grid topology is from @FERC @EIAgov @EPA and @DHSgov. Weather data is processed from @NOAA.
What are the main conclusions?
1. Co-optimization with distribution is important for future system planning (especially with electrification - to be reported in a future study from scenarios already modeled)
1. Co-optimization with distribution is important for future system planning (especially with electrification - to be reported in a future study from scenarios already modeled)


2. Local solar and storage (along with DSM, DR, EE) reduce costs dramatically when their value is assigned more accurately.

3. Clean electricity (when considering DERs) is CHEAPER than non-clean electricity (w/o DERs).

4. Clean electricity w/ DERs is nearly half a trillion dollars lower cost than clean electricity w/o DERs. The DERs enable MORE utility-scale wind and solar; which helps reduce costs. There is also a reduction in nuclear generation and capacity when DERs are co-optimized.

Want to know more? Our full technical report will be out shortly. Otherwise, please add questions and comments in this thread. (END)

PS - if you DM us, we will try and provide a draft of the technical report (under embargo). A prize for getting this far into an #energytwitter thread!
Much more can be found here: localsolarforall.org/roadmap
Adding clarification here:
https://twitter.com/VibrantCE/status/1334207637114785798?s=20
• • •
Missing some Tweet in this thread? You can try to
force a refresh