
This one really bothered me during yesterday's press conference. The [linked] video [below] is of Dr. Andy Thomas of Wexner Medical Center saying things that sound really scary. None of what he said is untrue, but it gives a perception that is vastly different than reality.
facebook.com/15501424/video…
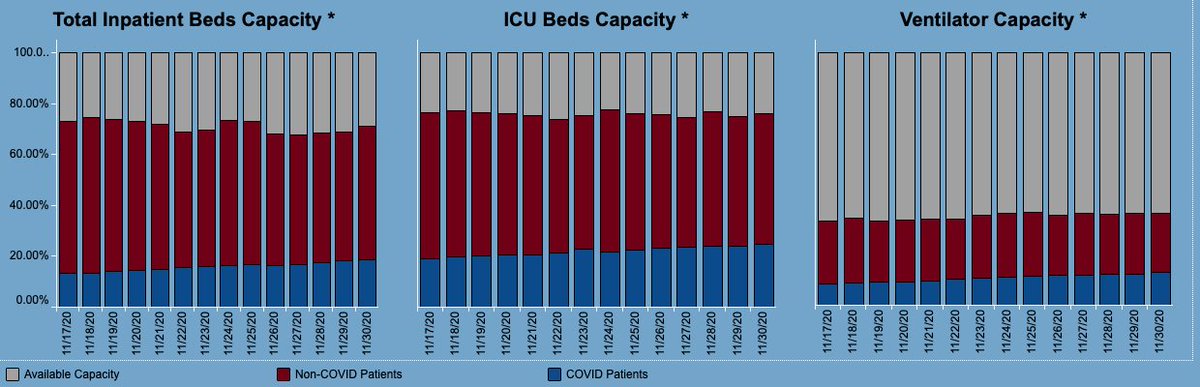
Yes, ~1/3 of all patients in the ICU or on a ventilator are COVID-positive (or at least once tested positive at some point in the last 8 months as my posts yesterday demonstrated).
Yes, ~1/3 of all patients in the ICU or on a ventilator are COVID-positive (or at least once tested positive at some point in the last 8 months as my posts yesterday demonstrated).
But then he went on to the old threat of COVID 'crowding' other procedures out. First, there is significant regular capacity still available in the ICU (and as he noted, even the facility with 'trouble' was able to increase to 130%).
Second - total usage has remained flat. Only the proportion of COVID-positive (not necessarily sick with COVID) has changed. That is the same across the board. Total usage remains flat. There is no sign that 'crowding' is actually happening.
It's the fear of crowding that is limiting procedures.
The other scare story was about the ventilators. Listen very closely to his words. The impression given was about dire need, scarcity. But in the end, there was nothing dramatic.
The other scare story was about the ventilators. Listen very closely to his words. The impression given was about dire need, scarcity. But in the end, there was nothing dramatic.
The facility was able to borrow ventilators quickly, so that they could "feel more comfortable." No one was ever at risk of not having one if they needed it.
And yes - there is a genuine shortage of staff to man the beds leading to real scarcity. And who is to blame for that?
And yes - there is a genuine shortage of staff to man the beds leading to real scarcity. And who is to blame for that?
At least in part - this man here, trying to scare you into shutting down your lives again, so things can be 'more comfortable' and his failures can be paid for by everyone else.
Listen very very carefully to his words, and examine the attached graph and see if the graphs convey the same message of fear. 
• • •
Missing some Tweet in this thread? You can try to
force a refresh


