Hold2 Profile picture
3 Dec, 4 tweets, 2 min read
Thread.

COVID vs. Hope-Simpson Flu Patterns: 12/3/20

We're not through a whole year yet, but patterns are emerging, and I wanted to take a closer look.

We'll start with NY/IL who both are N. Temperate but not exactly the same climate pattern.

/1
Now FL/TX.

FL is closest to true N. Tropical.

TX is very large with varying climates. Some are almost as far north as the southern tip of IL but most pop is further south.

Like IL vs. NY, we would not expect TX to mirror FL exactly but to be much closer to FL than IL/NY.

/2
Now all 4 together. Notice the "W" shape mixing the N Temperate with N Tropical.

Also notice the obvious high winter peak for NY/IL that drops to near-zero in summer.

Notice the lower wave pattern for FL/TX that never gets to zero. Summer peak occurs; winter peak higher?

/3
The pattern seems unaffected by Non-Pharmaceutical Interventions (NPIs). However, economic health, children's education, and Constitutional freedom are heavily-affected.

We need the CDC, academia, and gov't leadership to be honest about the true results and costs of NPIs.

/End

• • •

Missing some Tweet in this thread? You can try to force a refresh
 

Keep Current with Hold2

Hold2 Profile picture

Stay in touch and get notified when new unrolls are available from this author!

Read all threads

This Thread may be Removed Anytime!

PDF

Twitter may remove this content at anytime! Save it as PDF for later use!

Try unrolling a thread yourself!

how to unroll video
  1. Follow @ThreadReaderApp to mention us!

  2. From a Twitter thread mention us with a keyword "unroll"
@threadreaderapp unroll

Practice here first or read more on our help page!

More from @Hold2LLC

19 Oct
US Update: 10/19/20

Graph 1: Daily Deaths + Current Hospitalizations

- Hospitalizations bottomed 4 weeks ago and then increased tangibly 2 weeks ago. That new increase trend already started abating the past 4 days
- Reported Deaths down 83 Week-over-Week (WoW)

/1 Image
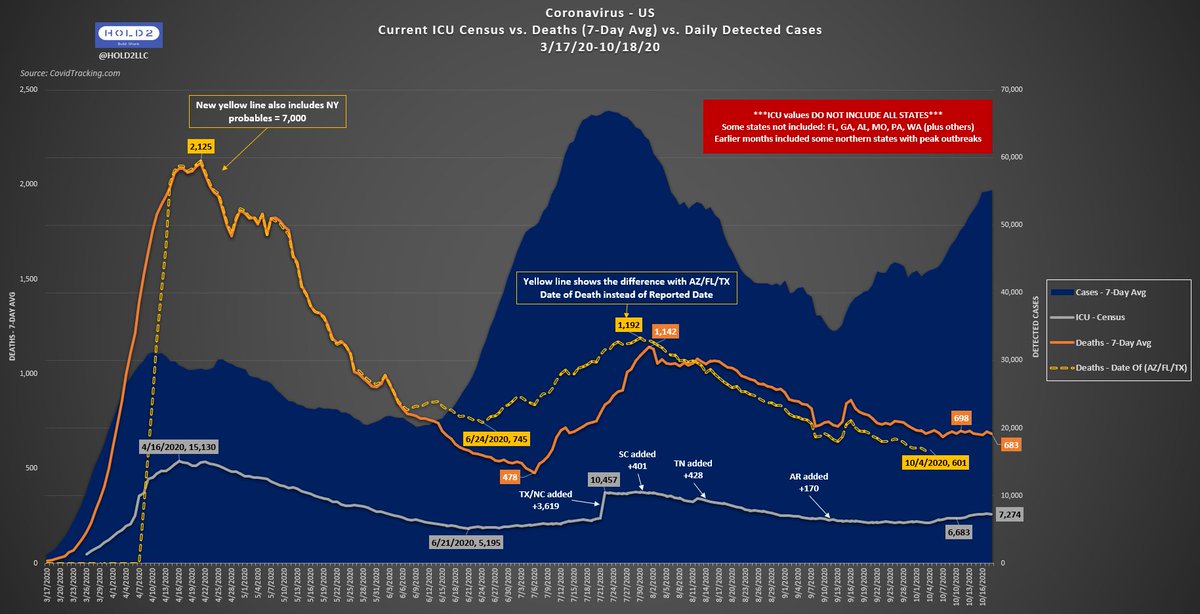
Graph 2: COVID ICU Census vs. Deaths (7DayAvg) vs. Daily Detected Cases

***Case hunting now in mega-hyperdrive and some states now include antigen positives (not antibody)

- 7-Day-Avg Reported Deaths down 15 WoW
- ICUs sizable jump last 2 weeks but peaking again already

/2 Image
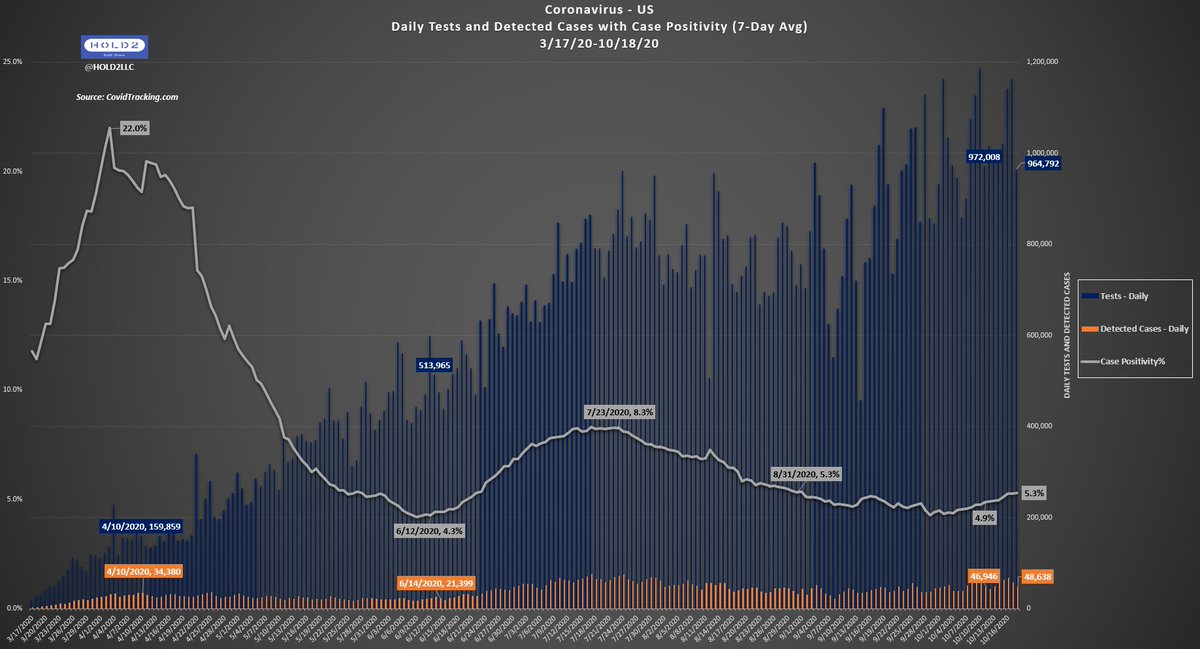
Graph 3: Daily Tests + Detected Cases + Case Positivity

***Last 10+ days have seen a real increase in Pos% that coincides with a bump in national CLI

- Test Positivity up 1.0 from trough
- Daily Test avg above 1M for 26 days
- Increase rate much lower than June surge

/3 Image
Read 6 tweets
4 Oct
US Update: 10/4/20

Graph 1: Daily Deaths + Current Hospitalizations

- Hospitalizations bottomed out and turned up a little
- Increases past week were mostly from WI (+118), NY (+120), MI (+120), PA (+129), TN (+134)

- Reported Deaths down 129 Week-over-Week (WoW)

/1
Graph 2: COVID ICU Census vs. Deaths (7DayAvg) vs. Daily Detected Cases

***Case hunting still in hyperdrive

- 7-Day-Avg Reported Deaths down 68 WoW
- ICUs below 6k again
- Date of Death curve is below the June/July low point and dropping

/2
Graph 3: Daily Tests + Detected Cases + Case Positivity

***Why are so many being tested daily, and who are they? CLI is at a national record low

- Test Positivity down 0.2 WoW
- 0.4 away from the low point in mid-June
- Tests up 43k WoW
- Detected Cases DOWN 3.4k WoW

/3
Read 6 tweets
3 Oct
US Update: 10/3/20

Graph 1: Daily Deaths + Current Hospitalizations

- Hospitalizations bottomed out and turned up a little
- Increase by 928 Week-over-Week (WoW)
- Reported Deaths down 9 WoW.

*Still a LOT of legacy death laundering (very old deaths counted as new)

/1 Image
Graph 2: COVID ICU Census vs. Deaths (7DayAvg) vs. Daily Detected Cases

***Case hunting still in hyperdrive

- 7-Day-Avg Reported Deaths down 31 WoW
- ICUs flattened but not increasing
- Date of Death curve is below the early July low point and receding

/2 Image
Graph 3: Daily Tests + Detected Cases + Case Positivity

***Why are so many being tested daily, and who are they? CLI is at a national record low

- Test Positivity down 0.3 WoW
- 4.4% Positivity yesterday; 7DA nearing low point
- Tests up 107k WoW
- Detected Cases DOWN 6k WoW
/3 ImageImage
Read 5 tweets
28 Sep
US Update: 9/28/20

Graph 1: Daily Deaths + Current Hospitalizations

- Hospitalizations bottomed out. Increase by 824 Week-over-Week (WoW)
- Hosps < 1/2 of peak
- Reported Deaths down 20 WoW.

*Still a LOT of legacy death laundering (very old deaths counted as new)

/1 Image
Graph 2: COVID ICU Census vs. Deaths (7DayAvg) vs. Daily Detected Cases

***Case hunting still in hyperdrive

- 7-Day-Avg Reported Deaths down 33 WoW
- ICUs no longer dropping
- Date of Death curve is now far below the early July low point

/2 Image
Graph 3: Daily Tests + Detected Cases + Case Positivity

***Why are so many being tested daily, and who are they? CLI is at a national record low

- Test Positivity no change WoW
- Tests down 99k WoW
- Detected Cases down 1,000 WoW
- 4.4% Positivity yesterday

/3 Image
Read 5 tweets
26 Sep
US Update: 9/26/20

Graph 1: Daily Deaths + Current Hospitalizations

- Hospitalizations turned back down but still slightly up Week-over-Week (WoW)
- Hosps < 1/2 of peak
- Reported Deaths DOWN 57 WoW.

*Still a LOT of legacy death laundering (very old deaths counted as new)

/1 Image
Graph 2: COVID ICU Census vs. Deaths (7DayAvg) vs. Daily Detected Cases

***Case hunting is in hyperdrive

- 7-Day-Avg Reported Deaths down 67 WoW
- ICUs still dropping
- Cases from mass/forced college testing + case definition changes still driving artificial increase?

/2 Image
Graph 3: Daily Tests + Detected Cases + Case Positivity

***Why are so many being tested daily, and who are they? CLI is at a national record low

- Test Positivity down 0.3%
- Tests up 26k WoW
- Detected Cases up 8,000 WoW (big jump relative to test increase)

/3 ImageImage
Read 5 tweets
25 Sep
US Update: 9/25/20

Graph 1: Daily Deaths + Current Hospitalizations

*Multi-Day Update

- Hospitalizations have the first Week-over-Week (Wow) rise since late July
- Reported Deaths DOWN 162 WoW. Still a LOT of legacy death laundering (very old deaths counted as new)

/1 Image
Graph 2: COVID ICU Census vs. Deaths (7DayAvg) vs. Daily Detected Cases

***Still seeing large backlog dumps of old deaths

- 7-Day-Avg Reported Deaths down 75 WoW
- ICUs keep dropping
- "Cases" from mass/forced college testing + case definition changes = artificial increase

/2 Image
Graph 3: Daily Tests + Detected Cases + Case Positivity

***Still don't see how so many tests are being done daily. Who are the people getting tested and why?

- Test Positivity down 0.5%
- Tests up 110k WoW
- Detected Cases up 214 WoW (0.2% Positivity)

/3 Image
Read 5 tweets

Did Thread Reader help you today?

Support us! We are indie developers!


This site is made by just two indie developers on a laptop doing marketing, support and development! Read more about the story.

Become a Premium Member ($3/month or $30/year) and get exclusive features!

Become Premium

Too expensive? Make a small donation by buying us coffee ($5) or help with server cost ($10)

Donate via Paypal Become our Patreon

Thank you for your support!

Follow Us on Twitter!