A bit of Sunday Twitter navel gazing.

Plot of scientists working on climate issues by their number of tweets and followers.

Verified accounts are circled. A somewhat random selection of extremal accounts have been labeled. Image
For the above plot, I used the set of scientists working on climate issues from @KHayhoe's excellent list.

twitter.com/i/lists/105306…
A few quick summary stats

3,135 Scientists

Number of followers

Median: 719
Mean: 2,066
Max: 171,387

Number of tweets

Median: 1,239
Mean: 4,649
Max: 307,513

In general, accounts with more tweets tend to have more followers. ~2/3 of accounts have more tweets than followers.
There are 54 verified accounts on the scientist list

Number of followers

Median: 14,931
Mean: 30,333
Min: 862
Max: 171,387

Number of tweets

Median: 13,273
Mean: 25,142
Min: 356
Max: 132,916
In addition to far more followers than average, verified accounts have tended to send far more tweets than average, crowding the top right corner of the graph.

Though only 1.7% of these scientists are verified, such accounts made 9.3% of tweets in this group.
Accounts with very high numbers of followers are more likely to be verified.

All 7 scientists on this list with over 70,000 followers are verified, as are 12 of the 15 most followed:


Scientists above 20,000 followers are verified more often than not.
However, there are also verified accounts with relatively few followers, including 10 verified accounts in this group with <5,000 followers.

Some, like @McKelvieWard25, have rather unusual real-world credentials for increasing notability.
Before I wrap up this bit of Sunday silliness, I want to mention that I also recently wrote another thread highlighting some of the excellent scientists who have over 20,000 followers but haven't yet been verified by Twitter.

• • •

Missing some Tweet in this thread? You can try to force a refresh
 

Keep Current with Robert Rohde

Robert Rohde Profile picture

Stay in touch and get notified when new unrolls are available from this author!

Read all threads

This Thread may be Removed Anytime!

PDF

Twitter may remove this content at anytime! Save it as PDF for later use!

Try unrolling a thread yourself!

how to unroll video
  1. Follow @ThreadReaderApp to mention us!

  2. From a Twitter thread mention us with a keyword "unroll"
@threadreaderapp unroll

Practice here first or read more on our help page!

More from @RARohde

4 Dec
THREAD) Climate scientists often don’t get as much recognition as they deserve.

For this #FollowFriday, I’ve prepared a list of 13 professional climate scientists, with at least 20,000 followers each, but which @Twitter has not yet @Verified.

Maybe change that @TwitterSupport?
First up, Professor Stefan Rahmstrof (@rahmstorf) is Head of Earth System Analysis at the Potsdam Institute for Climate Impact Research.

He is a leading climate scientist, 2017 winner of the @theAGU's Climate Communication Prize, and an expert on the oceans. 2/
Dr. Kate Marvel (@DrKateMarvel) of Columbia University & NASA’s Goddard Institute for Space Science.

She develops and evaluates climate models, while also frequently writing & speaking about climate change. One of @TIME’s "15 Women Leading the Fight Against Climate Change". 3/
Read 18 tweets
19 May
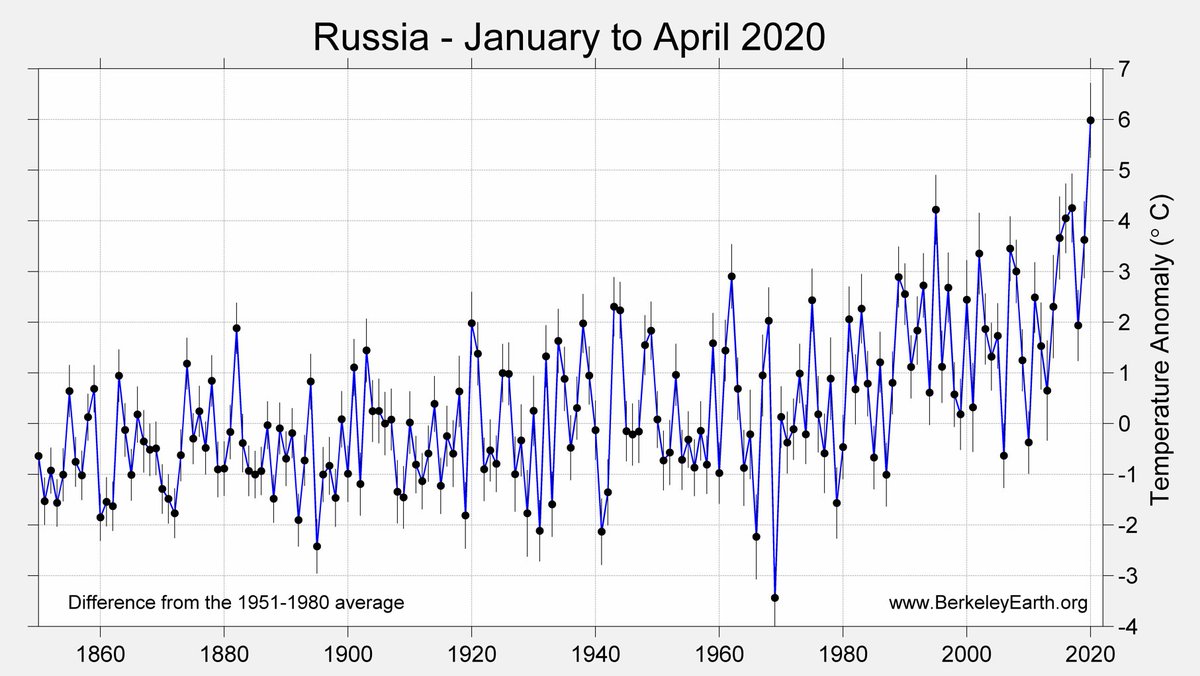
If 2020 ends up as a new record warm year, and it might, then a significant component of that will have been the incredibly warm start of the year that has just occurred in Asia.

1/
January to April, Russia averaged nearly +6.0 °C (+11 °F) above historical norms. That's one hell of a "mild winter".

That's not only a new record anomaly for Russia. That's the largest January to April anomaly ever seen in any country's national average.

2/
In what may be a sign of worse to come later this year, the exceptionally warm winter has been followed by unusually large early season wildfires in Russia.

washingtonpost.com/world/europe/w…

3/
Read 5 tweets
8 Apr
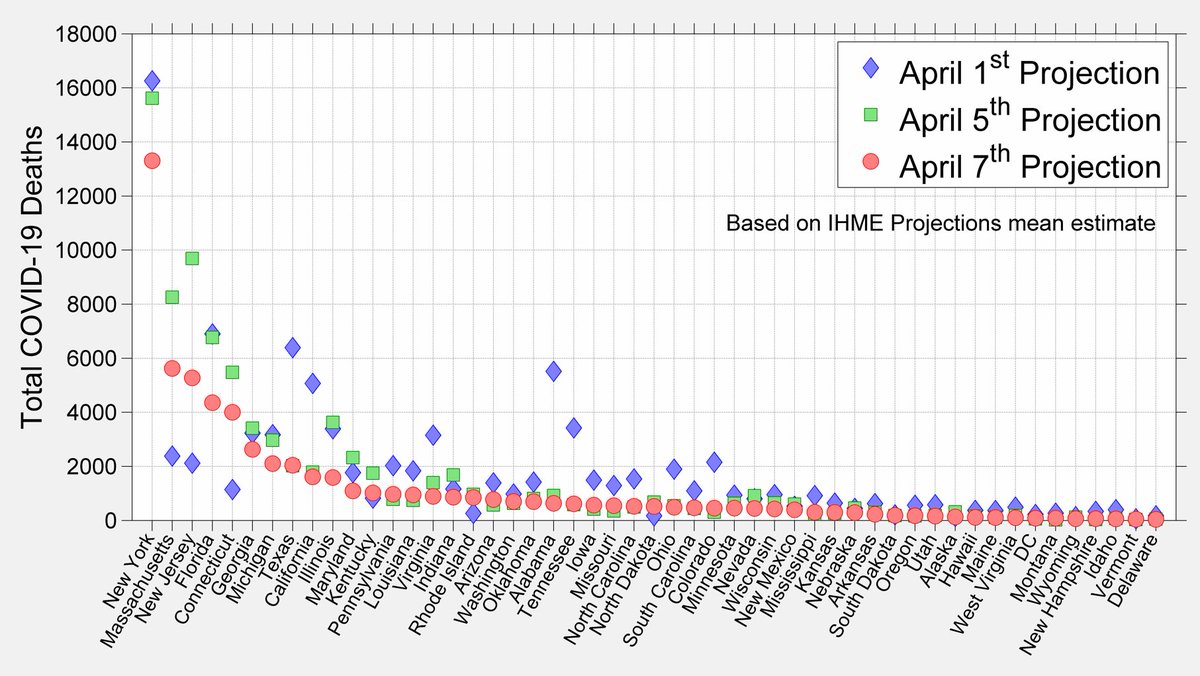
IHME has updated their US states COVID-19 model again.

Their new best estimate for US total deaths during the first wave has fallen to 60,000 (from 83,000 two days earlier).

healthdata.org/covid
As with the last release, they expect all US states will see their initial peak at some time during April, though with some earlier than others.

A few of these have been reshuffled, with a slight overall shift towards earlier peaks.
Because the IHME model is trained on a lagging indicator, i.e. per state deaths, I haven't been surprised to see their total projected deaths be revised downward (93,000 -> 82,000 -> 60,000), and wouldn't be surprised if it goes somewhat lower still.
Read 4 tweets
7 Apr
Simplistic (and therefore probably stupid) curve fit to USA COVID-19 cases and deaths.

If you want to be an optimist, then the USA may be near the peak of its new cases, and the first wave could even be mostly over by May.
To be clear the above plot is just a dumb curve-fitting exercise, but that simple model does fit the observations pretty closely.

The IHME modeling group is also doing curve-fitting with error functions, but they go state-by-state and ultimately predict ~82,000 deaths.
A second problem with such simple modeling is that it can't really answer the question of what comes next.

If you fit an error function (or similar curve) then you are explicitly assuming that COVID-19 will just go away after the peak. That's pretty unlikely.
Read 6 tweets
2 Apr
THREAD

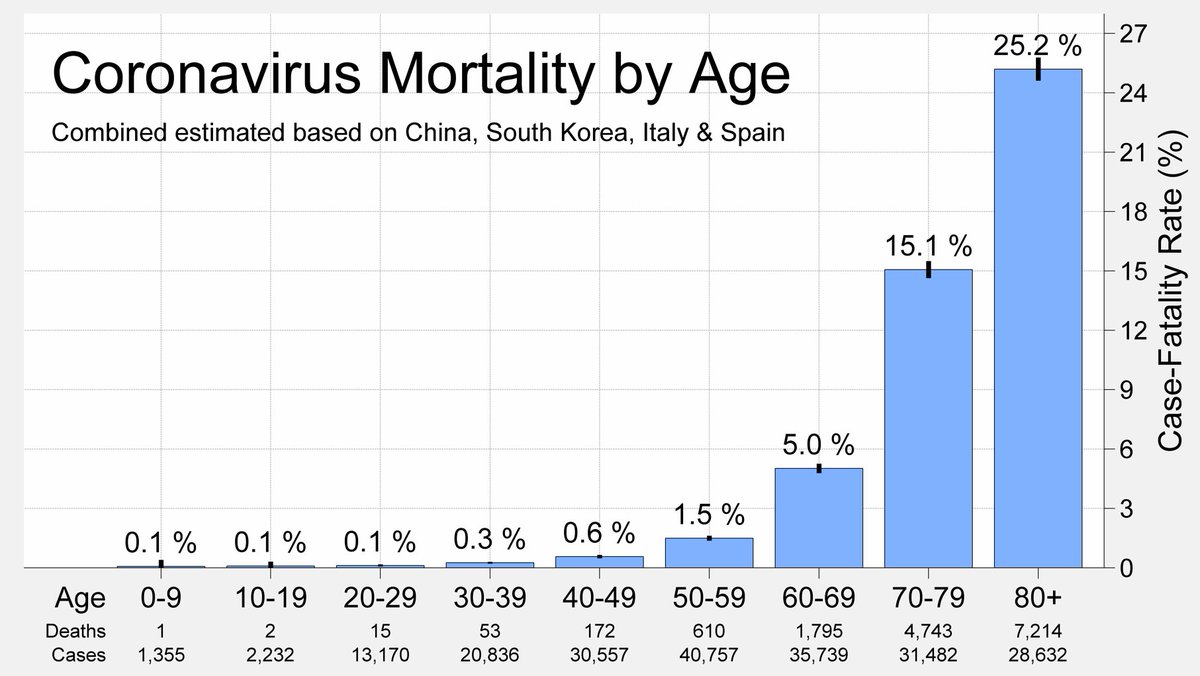
Let's talk a little bit about COVID-19 mortality and age differences.

Firstly, it has been clear from the early days of this disease that older people (and those with preexisting conditions) are at much higher risk.
Right now, 1 in 4 people over the age 80 diagnosed with COVID-19 has died, as have 1 in 7 over age 60.

That compares to fewer than 1 in 900 deaths for people under the age of 30.

2/
That's not to say that COVID-19 is an easy disease for young people. Even though >99% of young adults recover, both Spain and the USA have reported that ~15% of their confirmed cases in young adults have needed hospital care.

Data for Spain shown.

3/
Read 11 tweets
26 Mar
THREAD

Let's look at COVID-19 case progression in South Korea.

South Korea's remarkable testing program (365,000 tested so far) continues to look effective at bending the curve, and the number of active cases continues to fall.

Though total cases continue to grow by ~100/day.
With a little bit of math it is possible to use the reported time series of cases, deaths, and recoveries to estimate the average case trajectory in South Korea.

In other words, from the time someone is diagnosed how long does it take for the case to be resolved.

2/
First, a word of caution, these empirical estimates of case progression are less precise and reliable than doing a comprehensive case review; however, available case progression data has mostly been limited to small samples right now, e.g. thelancet.com/action/showPdf…

3/
Read 8 tweets

Did Thread Reader help you today?

Support us! We are indie developers!


This site is made by just two indie developers on a laptop doing marketing, support and development! Read more about the story.

Become a Premium Member ($3/month or $30/year) and get exclusive features!

Become Premium

Too expensive? Make a small donation by buying us coffee ($5) or help with server cost ($10)

Donate via Paypal Become our Patreon

Thank you for your support!

Follow Us on Twitter!