Two centuries of energy transitions in one animated graphic: see how U.S. energy use has changed from 1800 to today using our interactive Sankey animation at us.sankey.rdcep.org. 1/x
#EnergyTransition #EnergyPolicy
#EnergyTransition #EnergyPolicy
Our work on U.S. energy history is the subject of a new article by @yayitsrob at @TheAtlantic
In this thread, we’ll highlight some of the most exciting findings and figures from our research. 2/x
theatlantic.com/science/archiv…
In this thread, we’ll highlight some of the most exciting findings and figures from our research. 2/x
theatlantic.com/science/archiv…
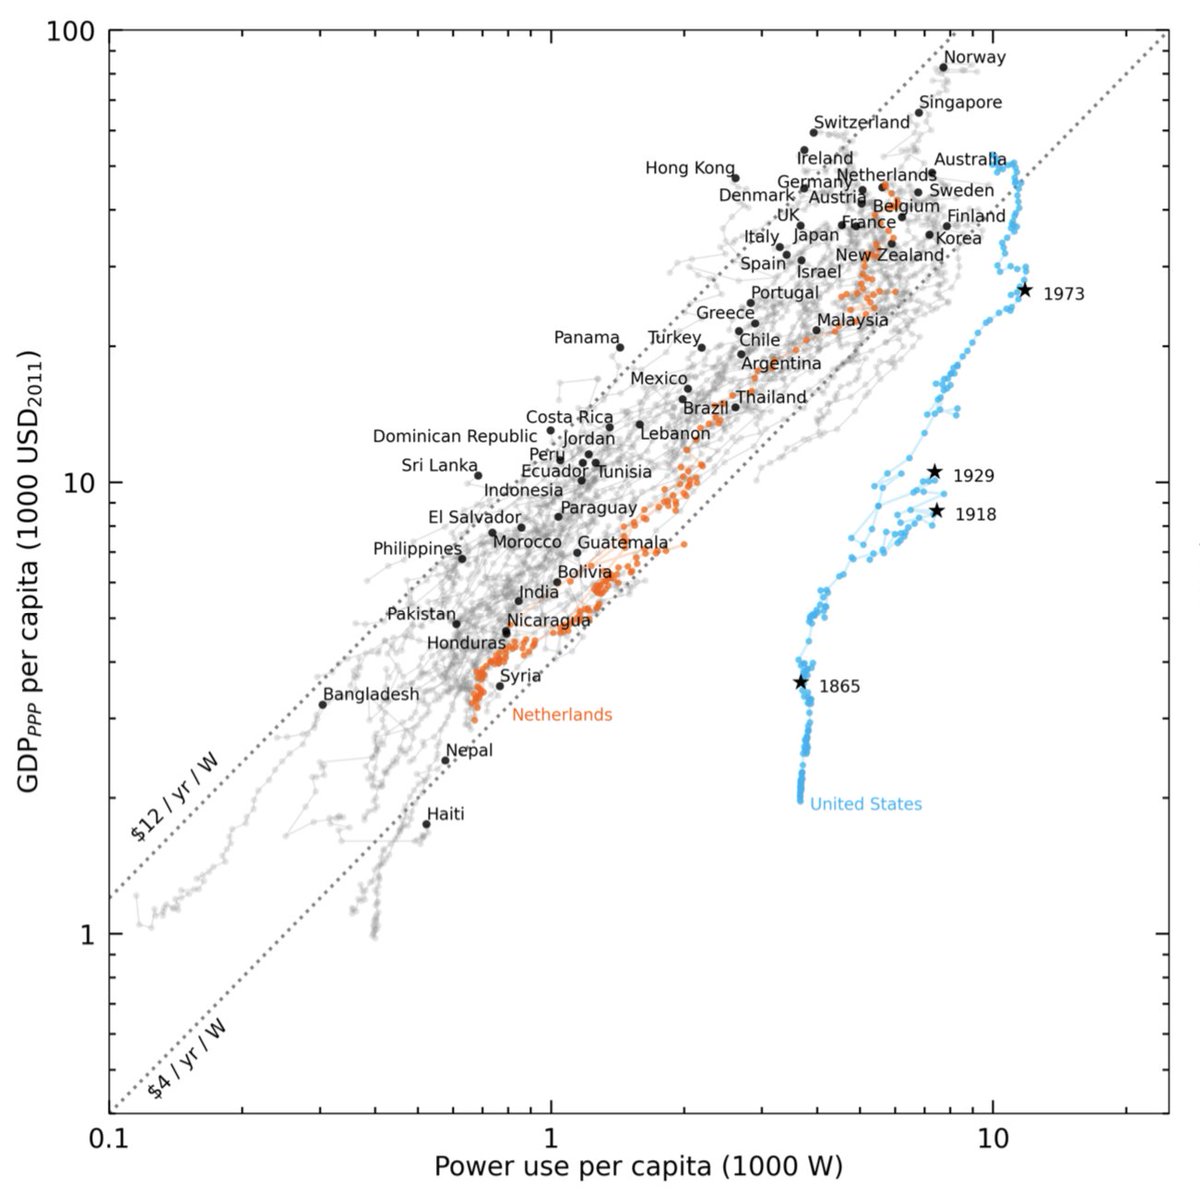
A historical puzzle: the U.S. is a strange outlier in its "energy intensity", using far more energy per dollar of GDP than most other countries, even over the same historical period. See our answer at bit.ly/3o8o8Qu. 3/x
#EnergyHistory
#EnergyHistory

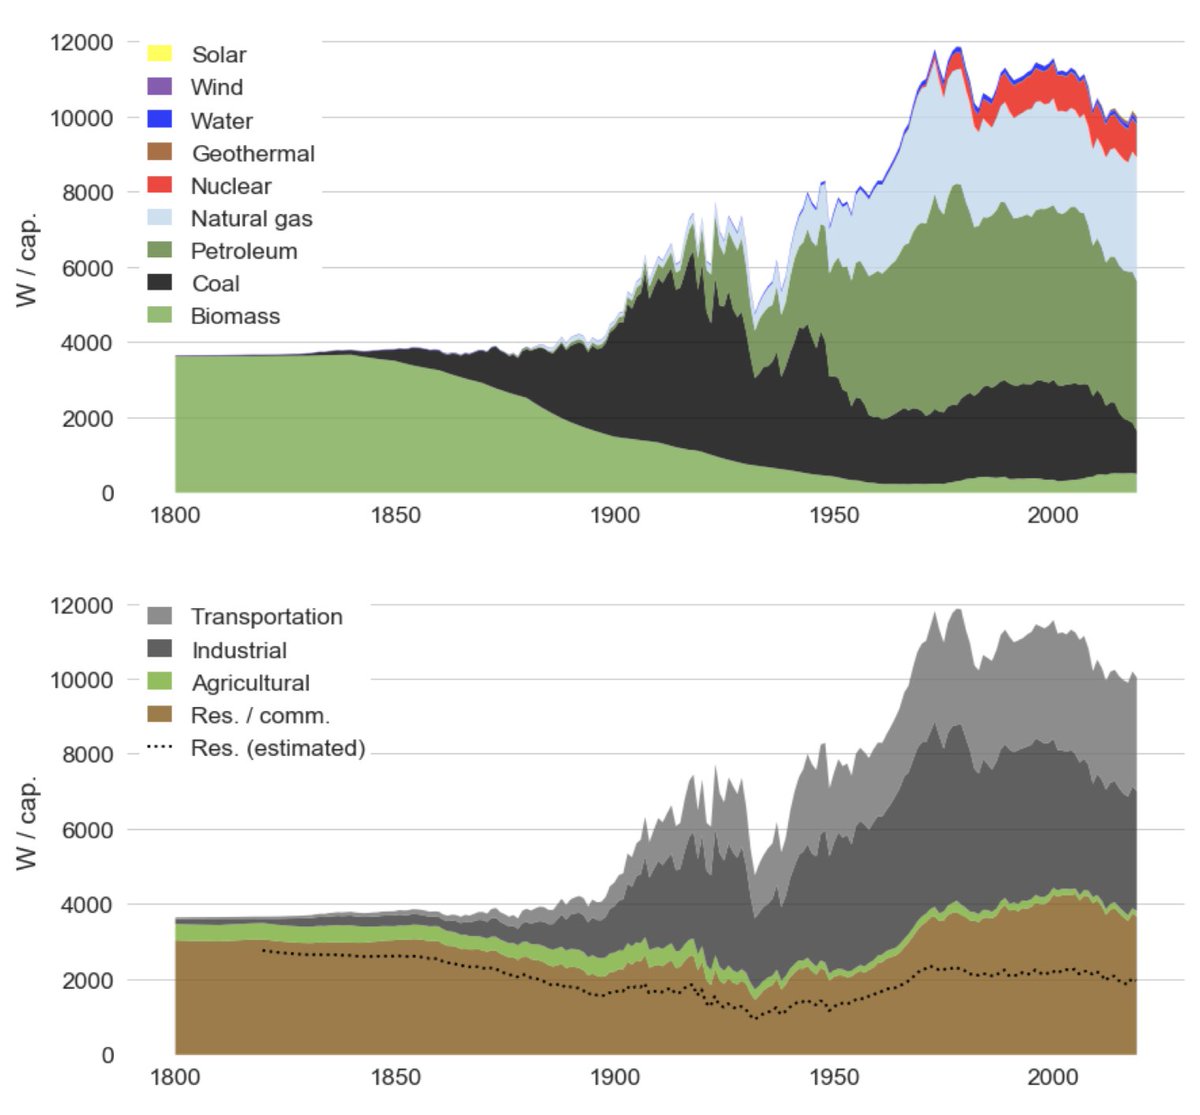
A different view of the historical evolution of U.S. "energy intensity". Improved efficiency? No, it’s mostly the growth of other sectors besides residential. See our answer at bit.ly/3o8o8Qu. 4/x
#EnergyHistory #EnvHist
#EnergyHistory #EnvHist

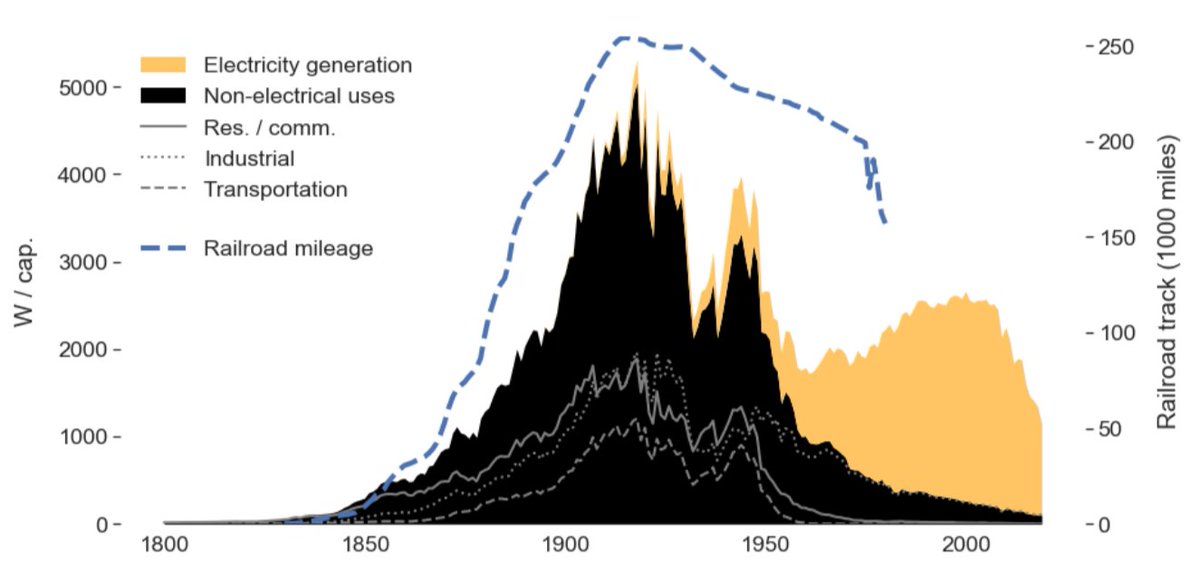
U.S. energy use and the growth of industrial and transportation sectors take off only with the railroads built after the Civil War. Lesson: midstream infrastructure is critical. No energy use without some means of supply.
5/x
#EnvHist
5/x
#EnvHist

The rise and fall of U.S. coal, 1800--2019. Per capita coal use peaked over 100 years ago, in 1918. Now, coal’s rebound in the electric sector is ending, too.
us.sankey.rdcep.org 6/x
#coal #EnergyTransition
us.sankey.rdcep.org 6/x
#coal #EnergyTransition

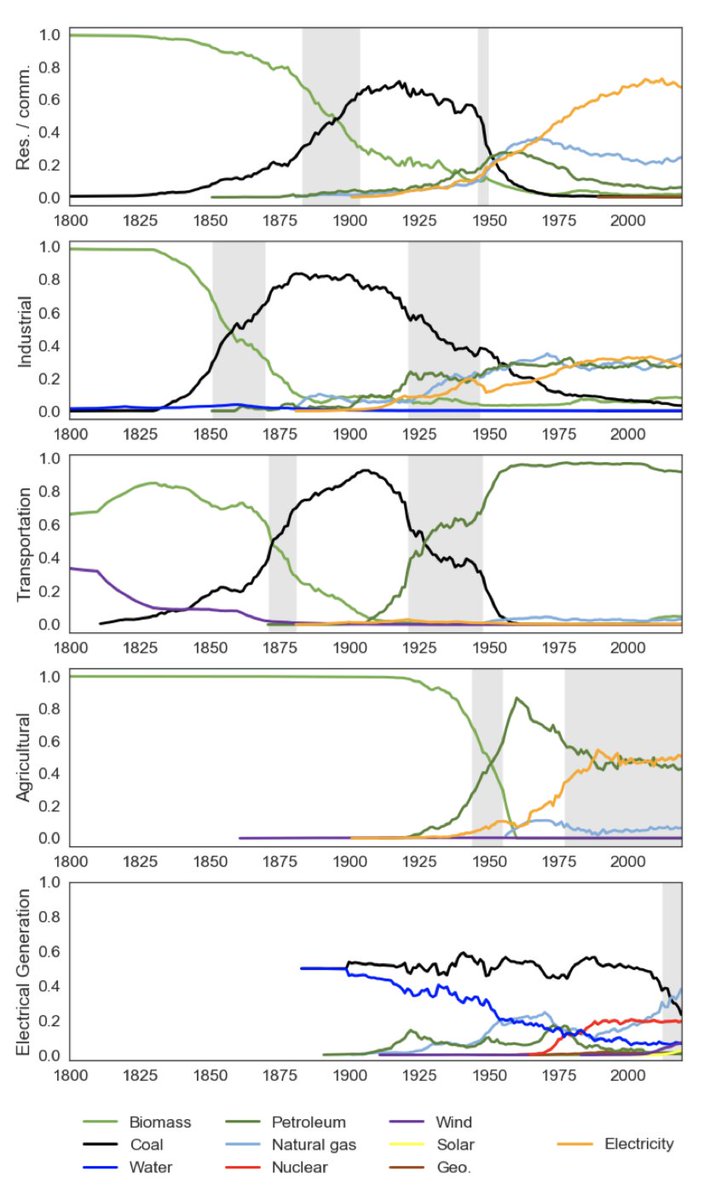
Energy transitions are not new in U.S. history. We count 9 total since 1800. The ongoing switch from coal to gas for electricity is as large and important as earlier transitions from wood to coal.
us.sankey.rdcep.org 7/x
#EnergyTransition #EnergyHistory
us.sankey.rdcep.org 7/x
#EnergyTransition #EnergyHistory

What will a future transition look like? Remember to check out the interactive animation at us.sankey.rdcep.org!
8/x
8/x
• • •
Missing some Tweet in this thread? You can try to
force a refresh


