
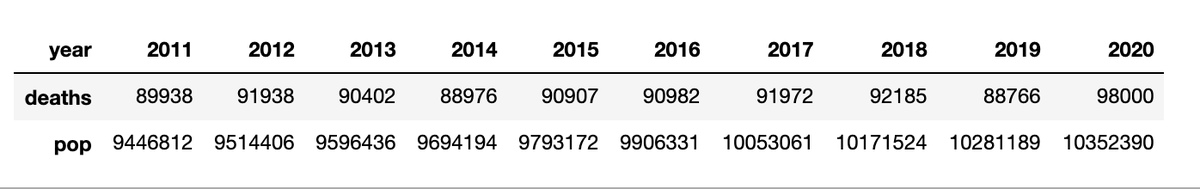
Sweden's two-year mortality rate in 2019-2020 is one of the lowest in the last 10 years.
I even overestimated 2020 deaths by 2-3%.
Share this to everyone you know who tries to point at Sweden as an example of covid policy failure.
Their strategy has been a huge success.
I even overestimated 2020 deaths by 2-3%.
Share this to everyone you know who tries to point at Sweden as an example of covid policy failure.
Their strategy has been a huge success.

Data is directly from Statistics Sweden - scb.se/en
Overall deaths have grown slightly but not in proportion to the population, so mortality rates have decreased.

2020 will have more deaths than 2019, but 2019 was an anomalously low year for mortality rate (about a 5% drop from 2018). 2020 will be about a 5-7% increase compared to 2018, essentially cancelling out the drop in 2019.
2019 might have had an abnormally low death winter season, pushing the most likely to die into 2020.
Continuing - it took me a while to realize that comparing mortality by year is a poor metric. January deaths are 15-25% higher in the US than July and more variable.
Example: Jan 2018 (bad flu season) had 30% more deaths than July 2017
Example: Jan 2018 (bad flu season) had 30% more deaths than July 2017
Is it really fair to penalize 2018 by its flu season? Bad cold flu seasons seem to run on 2-4 year cycles, so aggregating 2 years (or more) should more fairly account for the varying degrees of winter deaths
Going further, it may be better to track deaths by year beginning from July 1 through June 30 to capture entire winter seasons.
Counting deaths from Jan 1 to Dec 31 counts two different halves of winter death seasons.
Counting deaths from Jan 1 to Dec 31 counts two different halves of winter death seasons.
If I were to take this analysis further, I would count deaths over 2-4 year periods where the year begins July 1. Perhaps using a rolling average to see a more accurate depiction of death trends.
Since this thread is getting some traction, I'd like to shamelessly let everyone know more about me.
I'm an independent python data science educator and author of several books - Master Data Analysis with Python - being the most popular.
dunderdata.com/master-data-an…
I'm an independent python data science educator and author of several books - Master Data Analysis with Python - being the most popular.
dunderdata.com/master-data-an…
I've spent about 500+ hours modeling covid cases and deaths throughout the world and have built a forecasting dashboard that is quite accurate
coronavirus.dunderdata.com
coronavirus.dunderdata.com
I also teach live classes (sadly not in-person this year) and have an upcoming introductory python and data analysis course starting in January.
I'm still running my Black Friday special to get 50% through the new year.
dunderdata.com/live-online-co…
I'm still running my Black Friday special to get 50% through the new year.
dunderdata.com/live-online-co…
I also teach customized private classes for corporations and schools. If you are interested, let me know! ted@dunderdata.com
This plot just got me permanently banned from the dataisbeautiful subreddit - their narrative is so fragile, they cant even handle a simple plot
• • •
Missing some Tweet in this thread? You can try to
force a refresh


