If we vaccinate 10 million people today, statistically 300 of them will die the very next day. Regardless if they actually got vaccinated or not.

Over the next months, it's important to watch for misinformation that blames adverse events on the vaccine.

Below is an example of the misinformation that can spread.

The annual incidence of Bell's palsy is ~25 per 100k. There were 4 cases out of 40k participants.

The FDA concluded it's "consistent with the expected background rate in the general population."

In statistics, this is a simple application of something called Bayes Rule.

In essence, we must consider the likelihood of an event happening independently.

For ex: a 90-year-old has a 1 in 6 chance of dying within a year. So this happening after a vaccine would not be unusual.
Furthermore, if you monitor for thousands of illnesses, of course you will find some that have a higher-than-usual incidence.

The same issue occurs when looking for statistical significance in academia: if you look at 1000s of variables, you can always find significant ones.

• • •

Missing some Tweet in this thread? You can try to force a refresh
 

Keep Current with Youyang Gu

Youyang Gu Profile picture

Stay in touch and get notified when new unrolls are available from this author!

Read all threads

This Thread may be Removed Anytime!

PDF

Twitter may remove this content at anytime! Save it as PDF for later use!

Try unrolling a thread yourself!

how to unroll video
  1. Follow @ThreadReaderApp to mention us!

  2. From a Twitter thread mention us with a keyword "unroll"
@threadreaderapp unroll

Practice here first or read more on our help page!

More from @youyanggu

14 Dec
Many people are unaware that the COVID-19 vaccine has significantly more side effects than the flu vaccine. I hope to see more honest discussions regarding this.

Props to @Cat_Ho for her realistic, data-centric reporting of this issue. It's much needed.

sfchronicle.com/health/article…
Some notable numbers from the vaccine trial participants after the 2nd dose (age 16-55):

- 16% developed a fever vs 0% for the placebo
- 59%/52% had fatigue/headache vs 23/24% for placebo
- 45% took pain medication vs 13% for placebo

Those age 55+ have a slightly lower rate.
In comparison, roughly 1% of flu shot participants report a fever (16x lower), and ~20% report fatigue/headache (2x lower).

On top of that, COVID-19 vaccine participants have to go through this twice. Though the side effects are milder after dose #1.

Read 12 tweets
11 Dec
By many accounts, the US will have 100 million vaccine doses by February.

I estimated yesterday that we need ~100 million people to gain immunity via vaccination to reach herd immunity.

So *theoretically*, we can reach herd immunity by March if we vaccinate the right people.
This involves allocating the initial (limited) supply of vaccines based on two main criteria:

1) Each individual receives only one dose instead of two.
2) We prioritize individuals who have not had a prior infection.

This would be temporary, until supply catches up.
There is some evidence, though inconclusive, that even one dose of the vaccine can have reasonable efficacy (potentially >80%).

Read 15 tweets
10 Dec
I launched a new page that shows the path to US COVID-19 herd immunity: covid19-projections.com/path-to-herd-i…

It's built on the assumption that herd immunity will be achieved via vaccination and natural infection.

Tl;dr version: I estimate a "return to normal" by June/July 2021.
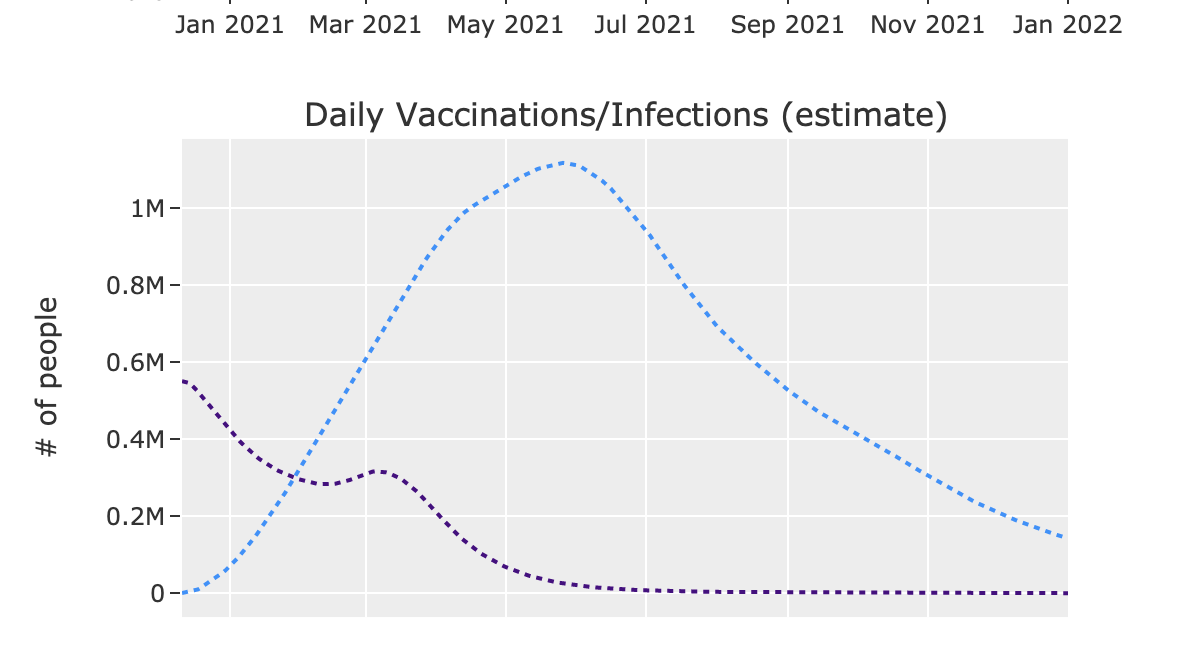
The underlying methodology is a simple model that simultaneously simulates daily vaccinations and new infections through 2022.

By May/June 2021, I estimate vaccinations to exceed 1 million people per day as they become available to the general public.
By mid-summer 2021, I estimate roughly 1/2 of the population have been vaccinated & 1/3 of the population have been infected.

After accounting for overlap/loss of immunity, this amounts to ~60% of the population possessing immunity to the virus, sufficient for herd immunity.
Read 8 tweets
9 Dec
The COVIDhub Ensemble model that combines all the models did not perform well over the past 2 months.

This is due to the fact that the majority of model submissions did not properly forecast this current wave.

Roughly half of all models failed to beat the baseline. ImageImage
This is a known issue with pandemic modeling. For most scenarios, it's beneficial for models to make forecasts close to the status quo (since that's usually true).

This means the they're accurate a majority of the time, but they will miss large spikes such as this current wave.
On the flip side, if a model predicts a large spike and is wrong, it will be heavily penalized by most evaluation metrics. This can happen even if the spike does happen but is a few weeks early/late.

That's the dilemma a lot of modelers face, including myself earlier this year.
Read 7 tweets
3 Dec
I posted the methodology for the new covid19-projections.com nowcasting model:

covid19-projections.com/estimating-tru…

I'm going to do a layman summary here, and hopefully receive some feedback from #epitwitter. Image
I've adjusted the methodology that I posted back in August based on new data and research:


Disclaimer: with that said, this is still a simple heuristic and hence is not perfect. There are more advanced methods (e.g. see covidestim.org).
The basic idea is this: for each day, we try to estimate the ratio of true infections to reported cases that day.

We call this the prevalence ratio, and we model this ratio as a function of the day and positivity rate: Image
Read 16 tweets
1 Dec
I deployed some new features to covid19-projections.com over the past week. Here's a brief summary:

1) Maps over time - you can now view how the pandemic progresses over time for the US, on both a state and county level: covid19-projections.com/maps-infection…
2) Plots of confirmed cases and deaths for every state and county in the US (in addition to estimates of true infections).

Example: covid19-projections.com/infections/us Image
3) Methodology writeup: covid19-projections.com/estimating-tru…. Will write a more detailed Tweet soon.

4) Daily county-level estimates: github.com/youyanggu/covi…. Due to storage constraints I moved it to a separate repository.
Read 5 tweets

Did Thread Reader help you today?

Support us! We are indie developers!


This site is made by just two indie developers on a laptop doing marketing, support and development! Read more about the story.

Become a Premium Member ($3/month or $30/year) and get exclusive features!

Become Premium

Too expensive? Make a small donation by buying us coffee ($5) or help with server cost ($10)

Donate via Paypal Become our Patreon

Thank you for your support!

Follow Us on Twitter!