PLC Profile picture
16 Dec, 13 tweets, 4 min read
It has now been 4 weeks since "cases" peaked in the northern Great Plains states; they have now fallen nearly 50% since mid-November despite mild restrictions and limited mask mandates:
Cases in the Rocky Mountain states appear to have peaked one week later (before Thanksgiving):
The southern Plains states seem to have hit a plateau before Thanksgiving and may have begun their inevitable descent:
The sunbelt, on the other hand, is still showing growth in cases, especially in the CA/NV/AZ region, with much more moderate growth (and perhaps a plateau) in the southeast:
The Northeast also looks as though we may be close to the top:
The Midwest region also looks as though it may have reach the peak for this season:
The Mid-Atlantic states are showing recent declines, outside of NC, but it is unclear if they are at the top, yet:
All-together, it should now be obvious that Covid cases follow a strictly regional-seasonal pattern and are indifferent to the variety of NPIs deployed as well as holiday travel (no Thanksgiving surge evident anywhere):
As a nation, cases seem to have peaked despite the assurances that Thanksgiving would lead to a spike in infections. Interestingly, the relationship between cases and deaths seems to have changed since this summer.
This summer, it appeared that there was a consistent 14 day lag between cases and deaths - but this has broken down in the fall:
@trvrb has suggested a 22 day lag, but that would imply that deaths increased BEFORE cases during the summer and this relationship has also broken down. The closest correlation currently between cases and deaths is a zero day lag.
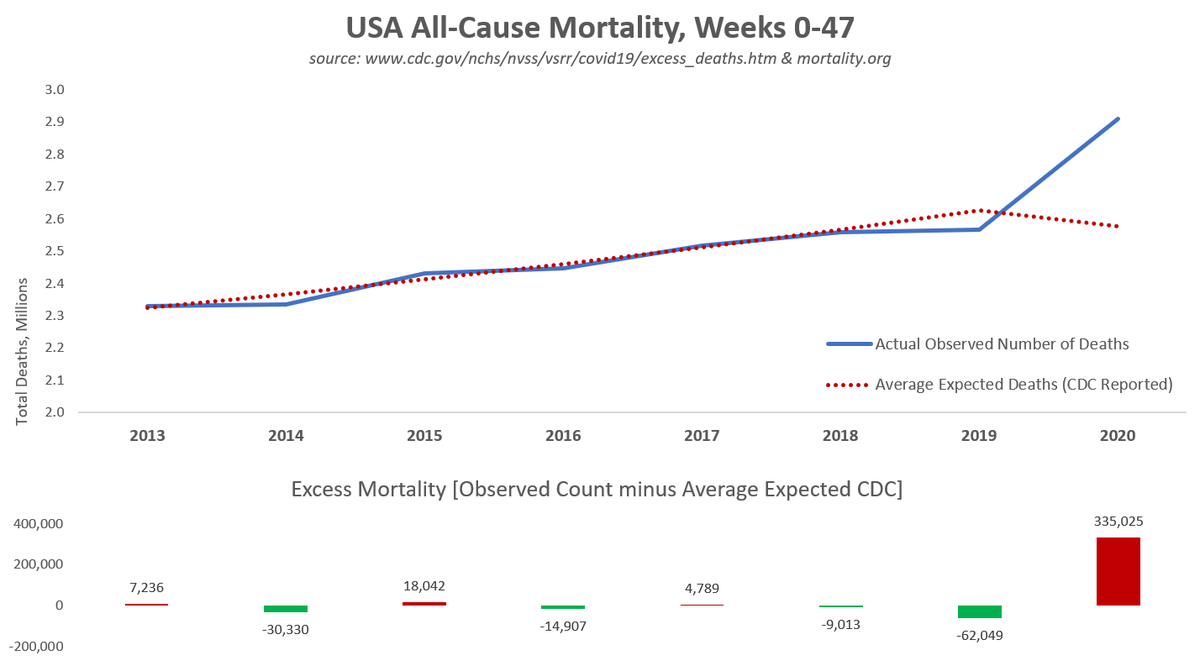
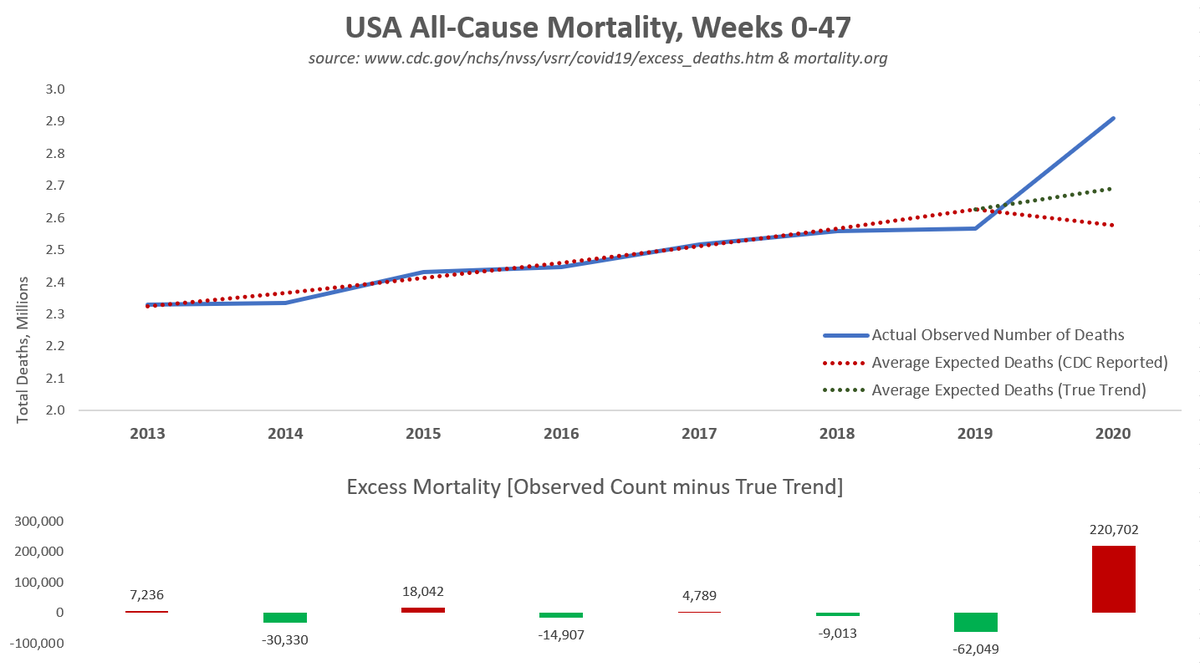
A zero day lag between cases and deaths likely indicates that some portion of deaths are simply being labelled "Covid". This is confirmed by looking at all-cause mortality. In mid-November, the CDC reported 4K excess deaths in a week with almost 11K Covid deaths:
It appears that more than 50% of currently reported Covid deaths are simply mislabeled "normal" deaths.

• • •

Missing some Tweet in this thread? You can try to force a refresh
 

Keep Current with PLC

PLC Profile picture

Stay in touch and get notified when new unrolls are available from this author!

Read all threads

This Thread may be Removed Anytime!

PDF

Twitter may remove this content at anytime! Save it as PDF for later use!

Try unrolling a thread yourself!

how to unroll video
  1. Follow @ThreadReaderApp to mention us!

  2. From a Twitter thread mention us with a keyword "unroll"
@threadreaderapp unroll

Practice here first or read more on our help page!

More from @Humble_Analysis

6 Dec
Officially, the CDC shows 335K excess deaths in 2020. But, something is very wrong with their baseline expected deaths. For some reason, they "expected" mortality to decline this year - after steadily increasing annually for the past decade:
If the CDC had simply extended their average expected deaths trend into 2020, excess deaths would be reduced by 114K. In other words, about 1/3 of CDC reported excess mortality is due entirely to an artificially low baseline:
To paint this in the best possible light, I believe the CDC may have reduced expected 2020 deaths because of the extraordinarily mild Winter deaths observed in 2019. However, past trends indicate that low mortality years tend to be followed by high mortality years.
Read 5 tweets
12 Oct
In the USA, for those under age 45, lockdown deaths exceed Covid deaths by nearly 2:1, through the end of August.
For those aged 45-74, lockdown deaths account for 23% of net Excess mortality; mortality displacement explains (at minimum) a further 24%.
For those older than 75, mortality displacement drove 26% of excess mortality and lockdowns drove a further 18%.
Read 4 tweets
12 Oct
Why are so many elderly dying of Covid? Mostly because those are the people who die, of any cause. Past age 45, Covid share of total deaths is fairly constant. Under 45, Covid mortality is vanishingly rare:
Across all age groups, Covid is rapidly disappearing as significant cause of mortality in the USA. This could be both because Covid deaths are declining and because lockdown-induced mortality remains high.
For those under 15, the risk of dying with Covid are literally 1 in a million while almost 1% of the 85+ group has died with Covid. To put that in perspective, 11% of those over 85 have already died this year, from any cause.
Read 4 tweets
3 Oct
The countries of Southeast Asia have reported essentially zero Covid-related deaths with many theories posited regarding the source of this surprising "immunity", but newly shared mortality data from S. Korea may have solved this mystery.
The Human Mortality database, a collaboration of UC Berkeley and the Max Planck Institute in Germany have recently added South Korea weekly mortality data back to 2010 which supports the "dry tinder" or mortality displacement hypothesis: Image
After a long period of remarkable consistency, South Korea has had three straight bad "flu seasons", with 2018 being especially bad. Unlike Europe and the Americas, 2018 was not followed by mild years but by two more bad years: Image
Read 7 tweets
2 Oct
The divergent outcomes between regions of the world is the single defining characteristic of Covid-19. For 75% of the world's population, there has been no pandemic. Even within Europe and the US, the regional variations are immense.
Just 20 nations account for 75% of total reported Covid deaths, all in W. Europe, S. America (+USA). In fact, for 85% of the world, there has been no pandemic. The impact appears entirely regional and government policy seems to have made no difference. So, what explains this?
Potential drivers of these results include: obesity rates, aged population, BCG vaccines, prior coronavirus exposure, vitamin D deficiency, nursing home policies, ventilator use, hospital access, lockdown severity. Likely all of these are necessary but not sufficient.
Read 5 tweets
1 Oct
There are a group of 13 states where all-cause mortality trends almost perfectly mirror those seem in euromomo.eu for Western Europe. In these states, the Covid pandemic ended almost twenty weeks ago: Image
Another group of states saw a wave of excess mortality in the Summer, but at a much less significant scale. For these states, it appears that the pandemic is currently winding down and deaths are returning to normal: Image
A third category(including CA) has seen either two moderate waves or a sustained mild uptick in mortality. These states also appear to be returning to normal, but they may continue trending with somehow higher than normal deaths: Image
Read 6 tweets

Did Thread Reader help you today?

Support us! We are indie developers!


This site is made by just two indie developers on a laptop doing marketing, support and development! Read more about the story.

Become a Premium Member ($3/month or $30/year) and get exclusive features!

Become Premium

Too expensive? Make a small donation by buying us coffee ($5) or help with server cost ($10)

Donate via Paypal Become our Patreon

Thank you for your support!

Follow Us on Twitter!