How to identify if an instrument trading sideways?

here are a few pointers

1. stock is stuck between swing high and low or SR zones which are in very tight range

2. Anchored vwap from last swing high and swing low converges each other and price howering near by

1/8
3. Short term moving average crosses long term MA several times in both direction in short period

4. Price crossing 200sma several times with flat 200sma with average or below average volume

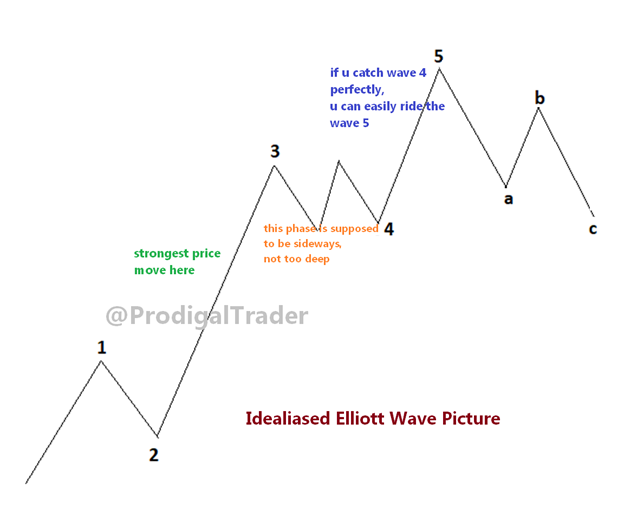
5. Contraction of price structure & formation of chart patterns

2/8
6. RSI trapped between 60 and 40 for long period & ADX measuring below 20

7. False break out on either sides at support n resistance

8. Price is overlapping between Ichimoku clouds, and taken/kejun and clouds are flat

3/8
9. Volumes lower than 20 days average trading volume, ADX less than 15, Low gap between +DI and -DI & Price between monthly and weekly pivot levels

10. Motherbar followed by inside bar followed by numerous bars inside the motherbar range

4/8
11. If CPR (Central Pivot Range) is wide, it can be a sideways move

12.
Flat 20ema - Current trend sideways,
flat 50ema - Short term trend sideways,
flat 100ema - Medium trend sideways &
flat 200ema - Long term trend sideways

5/8
13. Upper TL and lower TL moves in horizontal direction accompanied with flat 21 EMA

14. Flat bollinger band and RSI is between 40 to 60

6/8
15.
An uptrend pulls into a “lower high”
But does not print a “lower low”
&
A downtrend pulls up a “higher low”
But does not subsequently print a higher high

7/8
the pointers here presented are compiled from the below tweet.
all credit goes to the ones who came up with the comments

• • •

Missing some Tweet in this thread? You can try to force a refresh
 

Keep Current with Aneesh Philomina Antony

Aneesh Philomina Antony Profile picture

Stay in touch and get notified when new unrolls are available from this author!

Read all threads

This Thread may be Removed Anytime!

PDF

Twitter may remove this content at anytime! Save it as PDF for later use!

Try unrolling a thread yourself!

how to unroll video
  1. Follow @ThreadReaderApp to mention us!

  2. From a Twitter thread mention us with a keyword "unroll"
@threadreaderapp unroll

Practice here first or read more on our help page!

More from @ProdigalTrader

14 Dec
Elliott wave theory says price moves in 5 waves up and 3 waves down
Let’s concentrate on the 5 wave up move part.

Here wave 1 is analogous to the first higher high after deeper correction. Here trend reversal sets in.

1/7
It followed by a deep correction in the form of wave 2. Having made a higher low in wave 2,
wave 3 confirms above the top of wave 1.
That’s supposed to be the strongest price move in the entire cycle.

2/7
This followed by a very shallow correction which usually lesser than 50% of the entire wave 3,
usually its lesser than 40% even.
This shallow pullback is a signal that another strong up move is on the cards.
That wave 5 which terminates the up move cycle.

3/7
Read 7 tweets
2 Dec
here is a sensible plan, which i would follow

u were in cash bcz market wasnt supporting delivery trades with long bias. So this is the primary factor u need ur analysis to b based upon.
The best tool to guage the market health is market breadth

1/13
such as advance/decline ratio, % of scrips abv 200 SMA, number of scrips at yearly highs etc. The idea behind it is find out a general condition which held true in the past bullish phases in the market.

2/13
Suppose in the past bull markets, there were >70% scrips abv 200SMA till the bull market finishes. So u can form a thesis that once we have this data coosses abv 70% critical level, u would be able to assess that market is starting a new bull market stage.
3/13
Read 13 tweets
23 Oct
Components of a focussed trading journal

A trading journal isnt just about recording basic trade details
Its a live market forward test report as well.
For that u need to assess & analyse various facets in trading separately

Here are the components of trading journal

1/12
1. Trade-specific details

The entry, SL, exit price/time,
Traded instrument,
Trade direction,
The result of the trade etc.

2/12
2. Analysis

logic behind the entry, SL and target levels.
Potential reasons for why trade might not work
Review of the same after trade completed.
Notes on scope of improvements etc.

3/12
Read 12 tweets
22 Oct
designing a #tradingsystem

Price- Bar/Candlestick/Heike Ashi
Supply Demand - Volume, Vwap, Volume Weighed MA
Momentum - Rsi/Macd/Stoch
Volatility - Bollinger Band/Keltner Band/ATR
Support/Resistance - Swing Pivots, MA, HVN, DP, Weekly/Monthly HLC

1/4
Use one from each category

Do not overload with multiple tools from same category
For example,
do not use stochastic and macd together.
Both measures momentum.
And both are imperfect in its own way.
Same goes true with other tools as well

2/4
One system to start with I would suggest here

Candlestick charting for price
Volume for supply and demand
Macd for momentum
Bollinger band for volatility
Swing Pivots for Support/Resistance

This is a good logical start

3/4
Read 4 tweets
19 Oct
Often u would find a struggling person talks philosophy
Bcz, that's easy
Kind of accepting what's happening as inevitable
It's fate & u r bound to take it

But very few guys,
refuse philosophy
decide to fight
Make a plan
start from scratch
&
persist with hard work

They win

1/4
Relate it with trading
Each and every successful trader was a struggling trader once
It's just becoz he decided to keep philosophy aside and worked upon his core weaknesses,
he became what he is now

2/4
Behind his present success, there would be lots of painful experiences and sacrifices wold be there
which he committed to fullfil his ambition.
That's the solo route to success in trading career

3/4
Read 4 tweets
19 Oct
thr exists no way of building conviction on ur trading process
except "backtesting"
Its not just about the response in price after the chart set up is formed,

scaling in potential
Volatility risk
Impact of demand etc etc
thr r lot many important parameters to b quantified.

1/5
All the trading decisions u take in ur trading
has to be backrtested for the last min 5 years data.
Suppose u havent done any backtesting, and u have position which goes against u
u would be just holding it based on ur emotions.

2/5
u dont have any idea about what are the chances for price to regain all the losses
But if u have done the BT, then u will have an exact point of price beyond which there is no hope for any recovery.

3/5
Read 5 tweets

Did Thread Reader help you today?

Support us! We are indie developers!


This site is made by just two indie developers on a laptop doing marketing, support and development! Read more about the story.

Become a Premium Member ($3/month or $30/year) and get exclusive features!

Become Premium

Too expensive? Make a small donation by buying us coffee ($5) or help with server cost ($10)

Donate via Paypal Become our Patreon

Thank you for your support!

Follow Us on Twitter!