Prof Profile picture
20 Dec, 8 tweets, 3 min read
I have been told a few times that I am biased against current restrictions and it is affecting my ability to see all sides of the debate.

I appreciate being challenged to evaluate my reasoning, and I appreciate the people who do this.

I agree I am biased. Here is why. (1/x)
I believe in the need for evidence-based practices.

I also believe that policies such as business closures or restrictions on life should be held to a very high standard of evidence, given all the harms that they do.

In the beginning, we did not know enough. Not anymore. (2/x)
Imagine knowing in March that after months of restrictions in CA and very lax rules in FL, this is what we would see.

Can you imagine anyone saying back then "Yeah, we should lockdown hard"?

Not a single person would support business closures. (3/x) ImageImage
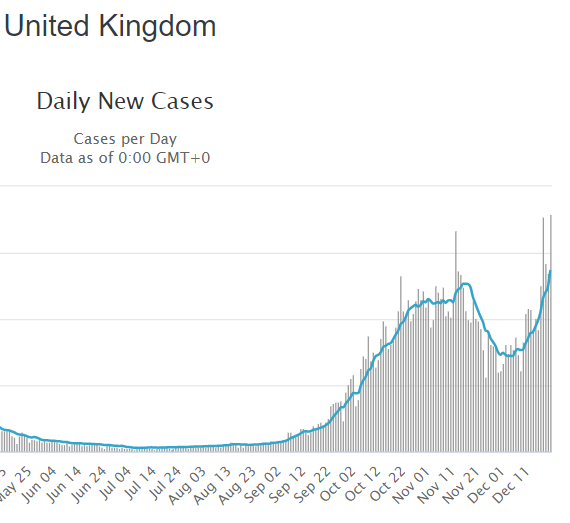
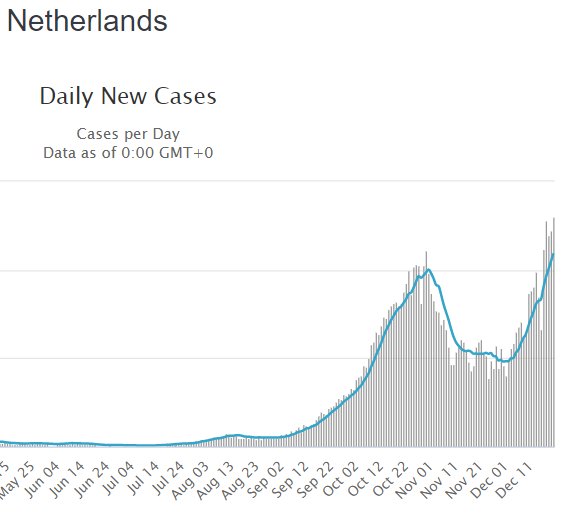
Real world evidence keeps showing that with or without government touch, curves go down when it is time.

Remember the doom Sweden was about to face, and then how it became "They are doing worse than their neighbors?"

I do. (4/x)

I believe reasons why people support lockdowns have not been rational for a long time. They are psychological.

Sunk cost fallacy. Fear. Tribalization. Illusion of control. Consistency bias. Internal locus of control.

These are why we still have people supportive of them. (5/x)
Lockdowns have not affected my life much, except for having to change how I teach a little. My income keeps coming. I was not much of a social butterfly before either.

Yet these restrictions, done haphazardly without any evidence, outrage me as I watch lives crumbling. (6/x)
Seeing how people act selfishly and with entitlement, and then package it as "caring for others" outrage me.

Seeing kids being sacrificed despite being at essentially zero risk outrage me.

Seeing people say they follow the science and then stay blind to data outrage me. (7/x)
So yeah, I am a bit biased.

Forgive me. Or don't.

I will continue to be biased. (8/8)

• • •

Missing some Tweet in this thread? You can try to force a refresh
 

Keep Current with Prof

Prof Profile picture

Stay in touch and get notified when new unrolls are available from this author!

Read all threads

This Thread may be Removed Anytime!

PDF

Twitter may remove this content at anytime! Save it as PDF for later use!

Try unrolling a thread yourself!

how to unroll video
  1. Follow @ThreadReaderApp to mention us!

  2. From a Twitter thread mention us with a keyword "unroll"
@threadreaderapp unroll

Practice here first or read more on our help page!

More from @covidtweets

21 Dec
Something interesting is happening in Europe: Population centers along the same latitude and region are seeing a rise starting exactly around December 3rd.

Any idea why? Anything these countries share aside from latitude? (1/x)
If it is the more infectious variant, as the UK claims, this would mean the variant is already widespread in those other countries as well.

However, I would not expect this to be the case, since the rise would be staggered rather than in concert if that were true. (2/x)
It cannot be human behavior either, as we have seen numerous times by now. The variance in human behavior is too big to cause such orchestrated moves, especially across borders.

Has there been any significant shift in weather in that area around after mid-November? (3/3)
Read 5 tweets
17 Dec
I believe that if we had spent 1% of the money we are burning on testing to supply everyone over 60 with enough N95s, and let the life to go on as normal, we would have max. 10% of the current mortality.

But we keep insisting on the wrong mode of transmission. (1/x)
We operate under a droplet model and do the things that should work, like masks, distance, contact tracing. None of those things work - as seen repeatedly since October.

Without any apparent change in human behavior, cases are skyrocketing. (2/x)
I wouldn't be surprised if we one day discover that this virus, like pollens, don't need droplets of any size (not even aerosols) to float in the air, at right temperatures/humidity. Like mold, it stays in the air, and infects when they find the right host environment. (3/x)
Read 10 tweets
6 Dec
COVID hospitalizations are breaking records, yet overall utilization seems relatively unchanged and mostly normal for this time of the year. How can this be?

How can hospitals both be overwhelmed but also have about the same number of beds available as a month ago? (1/x)
Let's say we randomly select a group of people from the population every day, and have them spend the night in a hospital. Of course they are not random, but that is not the point.

When there is more spread, more of the people who are selected each day will have it. (2/x)
Let's look at NC numbers. The situation is similar in many places.

COVID hospitalizations increased by about a thousand in the past month, but overall utilization is the same. How is this happening?

It is all about COVID unit capacity. (3/x)
Read 8 tweets
29 Nov
I am beginning to think that the widely accepted model of COVID mainly transmitting between close contacts via droplets is insufficient to explain the data and failing the Occam's razor. Instead, aerosols being the main route of transmission does better in both. (1/x)
Before I explain my reasoning, usual caveats: I am not a virologist/epidemiologist/medical professional/etc. I am just a scientist in another field who is observing the data and trying to make sense of it. So take the following with the usual grain of salt. (2/x)
First, what is Occam's razor? It means generally the theory which require the least number of assumptions is correct. A good example is geocentric vs. heliocentric models, the latter of which requires only one assumption - planets orbit the Sun. (3/x)
ImageImage
Read 13 tweets
23 Nov
Additional analysis on Kansas mask data: Does the size of the first wave (case levels before June) have an impact on the change in cases between August 11th - November 20th? (1/x)

Using population adjusted case numbers, below are the correlations between first wave cases, mask mandate, and change in cases after August. There is a significant negative correlation between first wave size and change after August. (2/x)
The correlation between masks and change is positive, meaning mandate counties had bigger changes. However, this is likely confounded by first wave size, as three counties with bigger first waves are non-mandate counties. (3/x)
Read 6 tweets
23 Nov
The new CDC study on mask effectiveness compares Kansas counties with and without mask mandates and finds that masks are effective.

Are they, really? (1/x)

cdc.gov/mmwr/volumes/6…
The first red flag comes from the data they used for analyses. They pick two seemingly random weeks from before and after the mandates and compare the changes in case numbers. They find that cases doubled in non-mandate counties and slightly declined in mandate counties. (2/x)
While this looks like cherry-picking, the results are actually similar when we compare mandate vs. non-mandate counties in terms of overall increase since August. On average, cases per 100K increased by x19 in non-mask counties vs. x9 in mask counties. (3/x)
Read 8 tweets

Did Thread Reader help you today?

Support us! We are indie developers!


This site is made by just two indie developers on a laptop doing marketing, support and development! Read more about the story.

Become a Premium Member ($3/month or $30/year) and get exclusive features!

Become Premium

Too expensive? Make a small donation by buying us coffee ($5) or help with server cost ($10)

Donate via Paypal Become our Patreon

Thank you for your support!

Follow Us on Twitter!