326 Covid-19 fatalities in the UK today. Not a record for a Sunday, but high, and after a low number last Sunday, and a slow rise over the last few days, things are looking grim. Here's the overall picture (1)
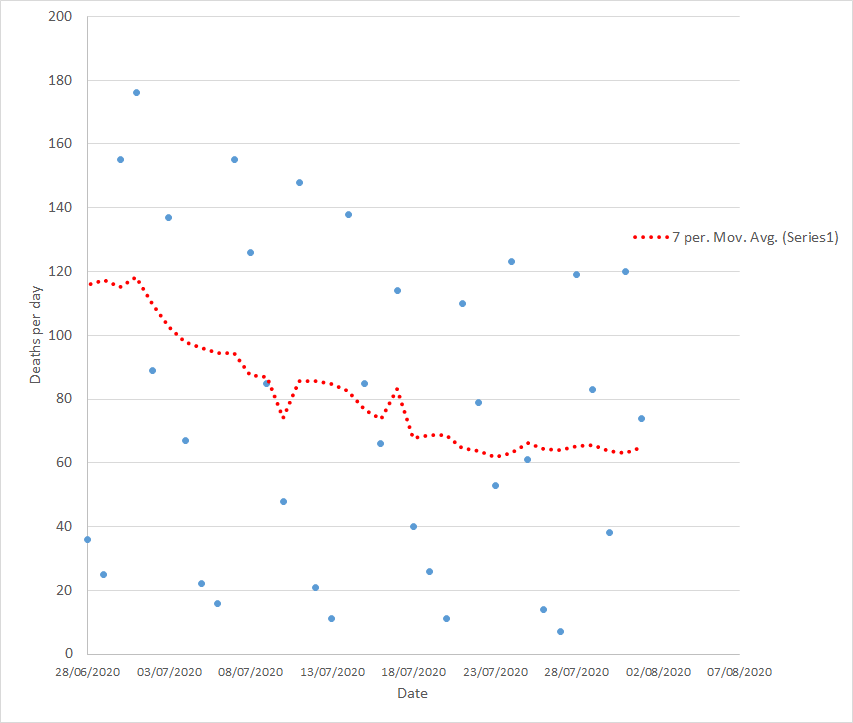
Have a closer look at the resent trend. Thats a worrying upturn. (2)
3234 dead over the last 7 days, thats the highest 7 day total since November 28th. That means that the peak we'd hoped not to pass in the second wave, the high point so far, might be passed again soon (3)
On every measure tings are going the wrong way. On every measure things are getting worse. We shouldn't quite yet be increasing deaths due to the end of lockdown 2, but here we are (4)
R at a 23 delay (best we can calculate it sing only deaths, thats how long on average it takes Covid to kill) just crept back over 1.1. (5)
The daily change in deaths is now definitely going the wrong way - the number being killed by Covid is about 1.5% more each day right now (6)
And just comparing waves 1 and 2, the lesson is clear - we worked to get over the first peak and we have resolutely failed to do so for the second. We're in colossal trouble (7)
Daily variation is still massive, but too many of the trends here are going up again. Tomorrow we would expect to be low (Mondays usually are) but as we approach Christmas we're expecting things to get worse (8)
Every day of the last 7 but 1 (Tuesday) saw a rise on the week before. Testing isn't coming any closer to catching up - we're catching a lower proportion of positive cases so track and trace is failing. (9)
Even using the governments ludicrous 28 day cut-of from test for Covid tests, we're going to go over 70,000 (mostly entirely preventable) deaths the day ater Boxing day. (10)
There are no positives to draw from todays Covid-19 data. Hospitalisations are terrifying, positive tests are colossal (35928) but obviously not getting anywhere close to catching all infection, lockdown 2 didn't get R far below 1 and we're already way above that again (11)
And on the data of the last week we could well be entering a slow exponential rise in deaths from the already -terrifying- daily averages we were seeing (12)
The extent to which Britain has mishandled this, from the outset, must now be clear to everyone. Worse than other EU countries. Worse than almost any other developed country. And the source of this failure, the blame, can be squarely and entirely placed with our government (13)
Its not NHS staff (more of whom have been killed by this disease than NATO servicemen were lost in the Gulf war), its not the populace who did their best despite constantly confusing, contradictory government advice (14)
...its not the terrified mass leaving cities in response to garbled and disgustingly late government uptake. Johnson. Sunak. Gove. Hancock. Patel. From 'herd immunity' 'take it on the chin' onward their policies have been a crime against humanity (15)
We've had bad governments in Britain. You have to go back to the potato famine to find a more intentionally callous, murderous regime in the British Isles. Don't forget. Don't forgive. Hold them to account. (fin)

• • •

Missing some Tweet in this thread? You can try to force a refresh
 

Keep Current with Cab Davidson #FBPE

Cab Davidson #FBPE Profile picture

Stay in touch and get notified when new unrolls are available from this author!

Read all threads

This Thread may be Removed Anytime!

PDF

Twitter may remove this content at anytime! Save it as PDF for later use!

Try unrolling a thread yourself!

how to unroll video
  1. Follow @ThreadReaderApp to mention us!

  2. From a Twitter thread mention us with a keyword "unroll"
@threadreaderapp unroll

Practice here first or read more on our help page!

More from @gnomeicide

21 Dec
So here's some good news. You stayed home, you didn't catch (or spread, if you caught it) Covid. Well done, you stopped 4 people getting it 5 days later (1)
That means 5 days after that 16 people didn't have it... And you get where this is going. It also means 33 days later, on average, you saved someone's life (2)
Because the number who die of this disease, the proportion, is more or less that. 3 generations worth of spread is enough such that about 1 person is dead. And the average time it would have taken to kill that person is 33 days (3)
Read 4 tweets
19 Dec
Another 489 needless and preventable fatalities due to Covid-19 announced in the UK yesterday. We may be reaching a new crisis point (1) Image
The recent trend is, sort of, kind of static. This reflects what lockdown 2 looked like - it stopped deaths rising. It hasn't caused a reduction in the death rate (2) Image
We'll break through 70,000 deaths soon, even using the governments entirely arbitrary and statistically shitty 28 day cutoff trick. (3) Image
Read 10 tweets
18 Dec
Right now, Covid deaths remain resolutely static in the UK. Here's the overall picture (1) Image
There are lots of ways of expressing the same data. I mean, that looks like things have levelled off, right? And thats... Good? Nope. Here's another way of looking at the same numbers, total dead (2) Image
For over a month now we've been trundling along with 400-500 deaths (on average) per day. That means we hit this point before the (very loose) second lockdown took hold of death figures and we haven't gone lower. Lockdown 2 did not work well enough (3) Image
Read 11 tweets
6 Aug
Mostly I don't stand out in a crowd. People don't hate me. I'm not very tall, or particularly noteworthy to look at in any way. But there's one thing I do every day that makes people hate me. Viscerally, and sometimes expressively and violently...
I can walk down any street in the UK and not stand out. There aren't no-go zones for white folk here in the UK, there aren't really 'no go zones' at all. If I talk to people, I've a Geordie accent. No one hates Geordies...
...in fact typically people smile and are immediately happy to hear a Geordie. Many surveys have shown it to be considered the most friendly and trustworthy accent...
Read 11 tweets
5 Aug
So... Nitram. Ammonium nitrate. Nasty stuff when it goes bang. And 2,750 tonnes just went bang. It's a big number. It's hard to take in. Some context... (1)
If it's a solid lump, with a density of 1.72, I make it that it would be near as dammit a cube 11.7m on each side. If it was solid. It wouldn't have been solid, but that's how much mass you need to visualise... (2)
You'd normally see it in 500kg massive pallet sized sacks. So, about 5,500 of those. A sense of scale is starting to emerge, yes? (3)
Read 14 tweets
1 Aug
Sorry to be a bringer of sad tidings, I really am, but todays figures for Covid-19 deaths in the UK are way above trend. 74. Here's the overall picture. (1)
The death total isn't going down. The seven day trend is upwards. Have a look at the most recent data here. The last month or so. We're looking at deaths per day remaining static, at present trending slightly up, over nearly two weeks (2)
The problem with big curves like the top one is that the human mind doesn't really take that in and see changing trends very easily. Log graphs help. As I keep saying, drop a log on it, if its straight then the trend is proportionally constant. Here's what that looks like now (3)
Read 15 tweets

Did Thread Reader help you today?

Support us! We are indie developers!


This site is made by just two indie developers on a laptop doing marketing, support and development! Read more about the story.

Become a Premium Member ($3/month or $30/year) and get exclusive features!

Become Premium

Too expensive? Make a small donation by buying us coffee ($5) or help with server cost ($10)

Donate via Paypal Become our Patreon

Thank you for your support!

Follow Us on Twitter!