New UI Report from @CAPolicyLab
(Me, @TillvonWachter, @alexbellecon & Geoff Schnorr)
Since March, we've written 8 reports analyzing the UI system + trying to explain how many people are receiving UI benefits.
Now we ask a different question:
Who has the UI system left behind?
(Me, @TillvonWachter, @alexbellecon & Geoff Schnorr)
Since March, we've written 8 reports analyzing the UI system + trying to explain how many people are receiving UI benefits.
Now we ask a different question:
Who has the UI system left behind?

We want to know who is “missing out” on UI.
i.e., "Who is unemployed, but isn’t receiving UI benefits?"
It’s hard to judge the trade-offs between UI extensions and other forms of economic relief without being able to say something about this question.
i.e., "Who is unemployed, but isn’t receiving UI benefits?"
It’s hard to judge the trade-offs between UI extensions and other forms of economic relief without being able to say something about this question.
To attempt to answer this question, we took a geographic approach:
We calculated the number of people receiving regular UI benefits in each neighborhood, and compare it to local estimates of unemployment.
(see techn. appendix for details)
We calculated the number of people receiving regular UI benefits in each neighborhood, and compare it to local estimates of unemployment.
(see techn. appendix for details)
We find that unemployed workers in some neighborhoods are substantially less likely to receive UI benefits than unemployed workers in other neighborhoods.
Areas with fewer UI recipients (per unemployed person) tended to be lower income, Hispanic neighborhoods.
Areas with fewer UI recipients (per unemployed person) tended to be lower income, Hispanic neighborhoods.

For instance, in Burbank, the number of people receiving benefits is roughly equal to the number of people who were estimated to be unemployed. But in East Los Angeles, less than half (44%) of the unemployed successfully claimed unemployment insurance benefits.

If unemployed workers in poorer neighborhoods had been able to collect regular UI benefits at the same rate (per unemployed person) as those in wealthier ones, the number of regular UI beneficiaries in the state would have been 23% higher.
Back-of-the-envelope calculations suggest that if all neighborhoods received UI at the same rate as wealthy neighborhoods, these areas would have seen an additional $445 million of regular UI payments per week over the course of the summer.

The UI system is designed to protect against individual-level shocks, while also serving as an automatic stabilizer- providing more $ to harder-hit areas.
Our research suggests poorer communities & communities of color are not benefiting from the system the same way others are.
Our research suggests poorer communities & communities of color are not benefiting from the system the same way others are.
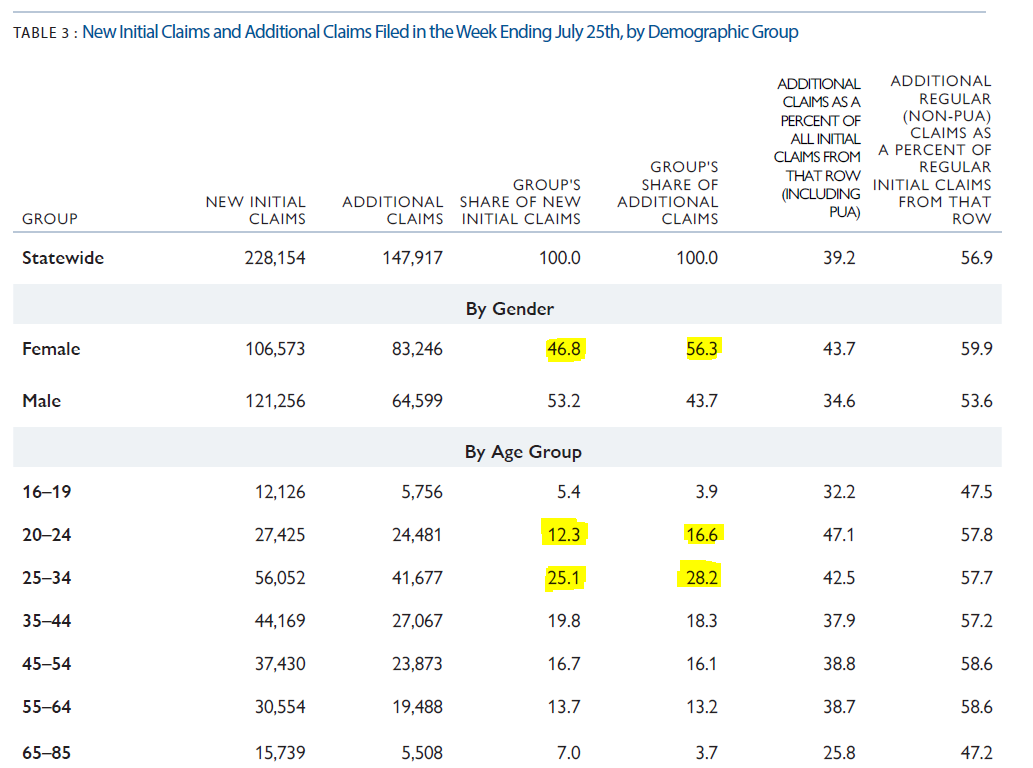
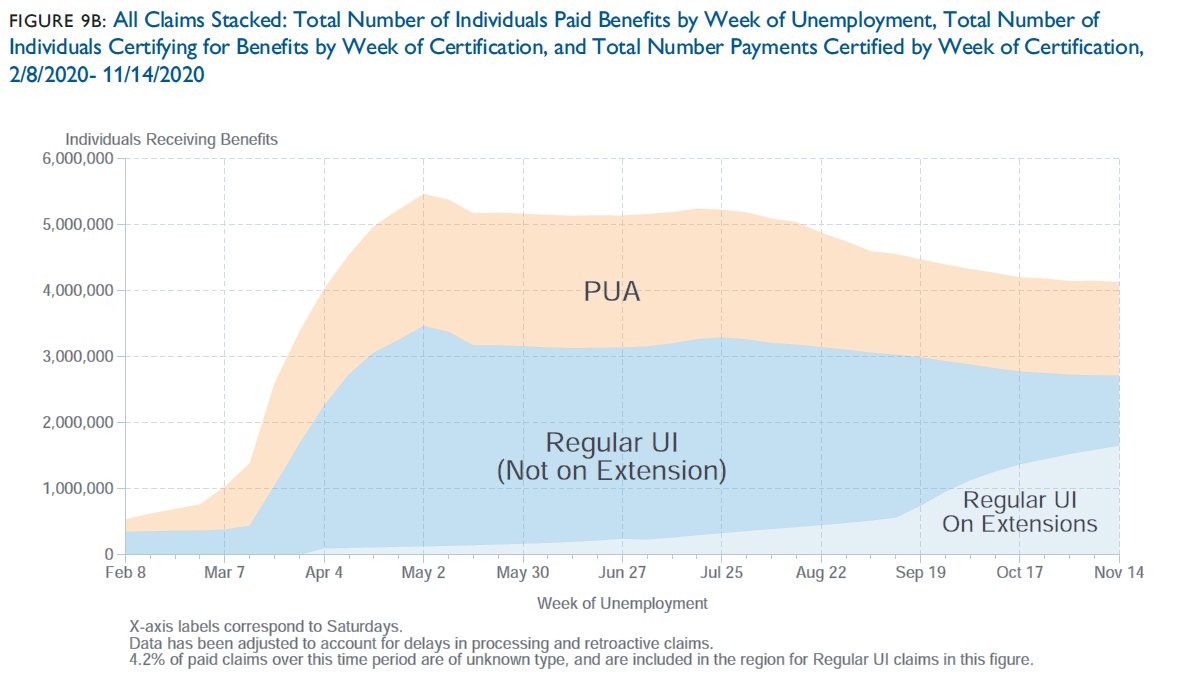
For the first time in our report series, we report estimates of the number of individuals receiving UI benefits each week after adjusting for typical patterns of processing delays. (Note this is quite different from DOLs cont. claims # - which counts certifications processed)
We find that the decline in the number of individuals receiving UI benefit which we saw in August-October no longer exists. There are just as many people on UI now as there were 5 weeks ago.
The "recovery" in California's labor market has effectively flatlined.
The "recovery" in California's labor market has effectively flatlined.

Furthermore, the number of people on extension programs (mostly PEUC) has been steadily growing each week - there are now more workers on extensions than there are on regular state UI benefits. Another reason for Congress to #ExtendUI
To track the recovery at a local level, we've created a "recovery index", which gauges the extent to which the # of UI recipients in each neighborhood is closer to its summer peak (0%) or it's pre-crisis benchmark (100%).
We find that the average neighborhood scored about 45%.
We find that the average neighborhood scored about 45%.

But again, we find substantial disparities between neighborhoods.
Neighborhoods with poorer, or more minority residents have seen slower economic recoveries than better-off areas.
What little recovery we have seen has been concentrated among higher income neighborhoods.
Neighborhoods with poorer, or more minority residents have seen slower economic recoveries than better-off areas.
What little recovery we have seen has been concentrated among higher income neighborhoods.

Finally, we look at the # of individuals currently receiving benefits relative to the size of their labor force.
The racial disparities are massive.
43% of the Black Labor Force in California is currently on receiving UI, compared to just 17% of Whites.
The racial disparities are massive.
43% of the Black Labor Force in California is currently on receiving UI, compared to just 17% of Whites.

You can read our full, much more detailed report (and play around with our interactive map) here: bit.ly/UIreceiptCA
It also includes a super fun technical appendix explaining our geographic analysis.
It also includes a super fun technical appendix explaining our geographic analysis.
Thanks to everyone who has provided us with feedback on these reports this year - we've learned an incredible amount from you guys, and I hope you've learned from us too.
We'll be back in 2021, hopefully reporting on more positive developments in the labor market.
We'll be back in 2021, hopefully reporting on more positive developments in the labor market.
cc'ing the UI/Econ/Policy All-Stars
@kevinrinz @ElizaForsythe @keds_economist @ernietedeschi @jc_econ @p_ganong @Jstein_WaPo @arindube @bencasselman @noahpinion @ryanlcooper @byHeatherLong @sechaney @Claudia_Sahm @TheStalwart @EricMorath @sechaney @paulgp @ENPancotti @pelhamprog
@kevinrinz @ElizaForsythe @keds_economist @ernietedeschi @jc_econ @p_ganong @Jstein_WaPo @arindube @bencasselman @noahpinion @ryanlcooper @byHeatherLong @sechaney @Claudia_Sahm @TheStalwart @EricMorath @sechaney @paulgp @ENPancotti @pelhamprog
+ other UI-adjacent folks who don't fit on tweet 1
@modeledBehavior @margotroosevelt @josheidelson
@jimtankersley @katedavidson @missRyley @sdonnan @JordanChariton @hshierholz @JHWeissmann
@dylanmatt @mattyglesias @jbarro @neil_irwin @ezra_klein @JustinWolfers @LightmanDavid
@modeledBehavior @margotroosevelt @josheidelson
@jimtankersley @katedavidson @missRyley @sdonnan @JordanChariton @hshierholz @JHWeissmann
@dylanmatt @mattyglesias @jbarro @neil_irwin @ezra_klein @JustinWolfers @LightmanDavid
Whoops! Here is another link to the report, since the 1st one appears to be broken: capolicylab.org/publications/d…
• • •
Missing some Tweet in this thread? You can try to
force a refresh