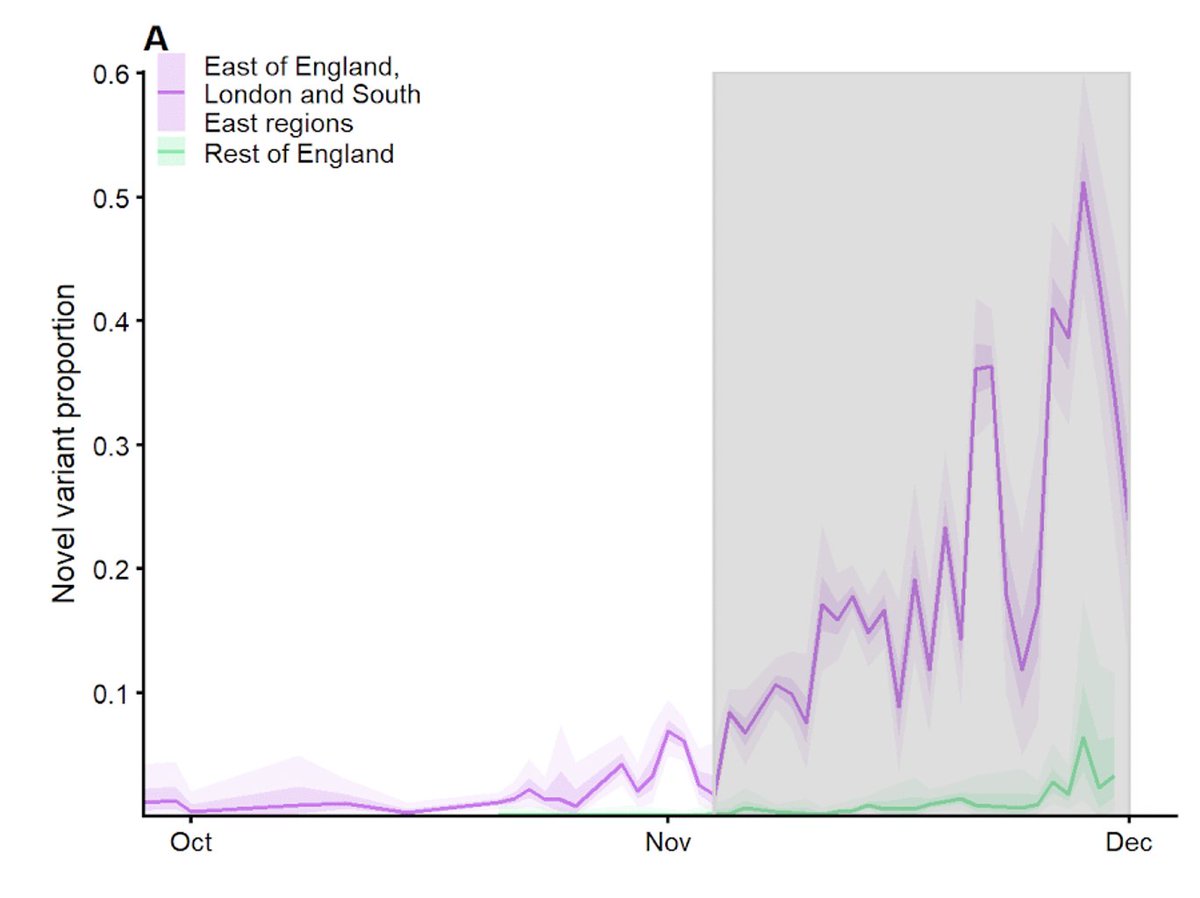
Just to comment on a few points that have come up in relation to the preprint we put out yesterday on VOC 202012/01, the new variant of SARS-CoV-2 in the UK. (
https://twitter.com/_nickdavies/status/1341845176361349123?s=20)
Is the apparent spread of VOC due to increased testing? This comes up often when cases rise & indeed case data is subject to biases. But we don't fit to case data in the model. Hospitalisations, deaths, and relative frequency (not abs. number) of the new variant define the trend.
There are other ways of measuring community prevalence besides case data. For example, the ONS just released a new round of estimates based on swabbing random people in England. Also shows increases in prevalence in the 3 regions we highlight to Dec 18. ons.gov.uk/peoplepopulati… 

Can we avoid closing schools? Model would say yes, provided transmission can be reduced in other sectors to compensate.
It's also possible that contact patterns will drop more in Tier 4 than they did during the November lockdown, which could help keep more schools open. Early data from mobility indices (like Google's Community Mobility) will help scientists to assess this.
I suspect UK scientists will be asked soon to look at different policy options in much greater detail than we were able to do here. This will give others and ourselves a chance to check our preliminary findings against new data coming in.
• • •
Missing some Tweet in this thread? You can try to
force a refresh


