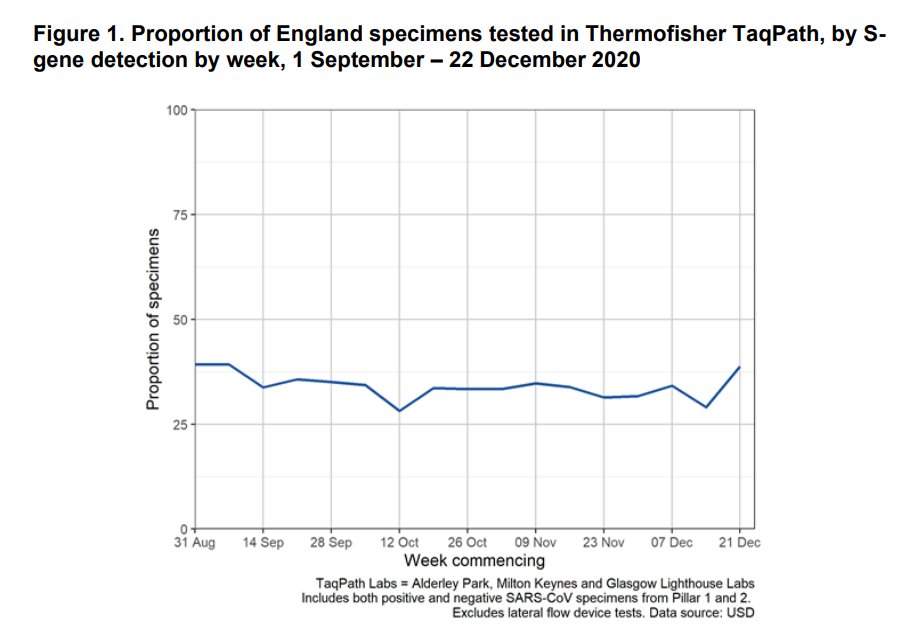
Had fun™ trying to extract S-dropout rates from the graph in the PHE report using an automated eyedropper. Take the values with a big pinch of salt!

theosanderson.github.io/adhoc_covid/ph…
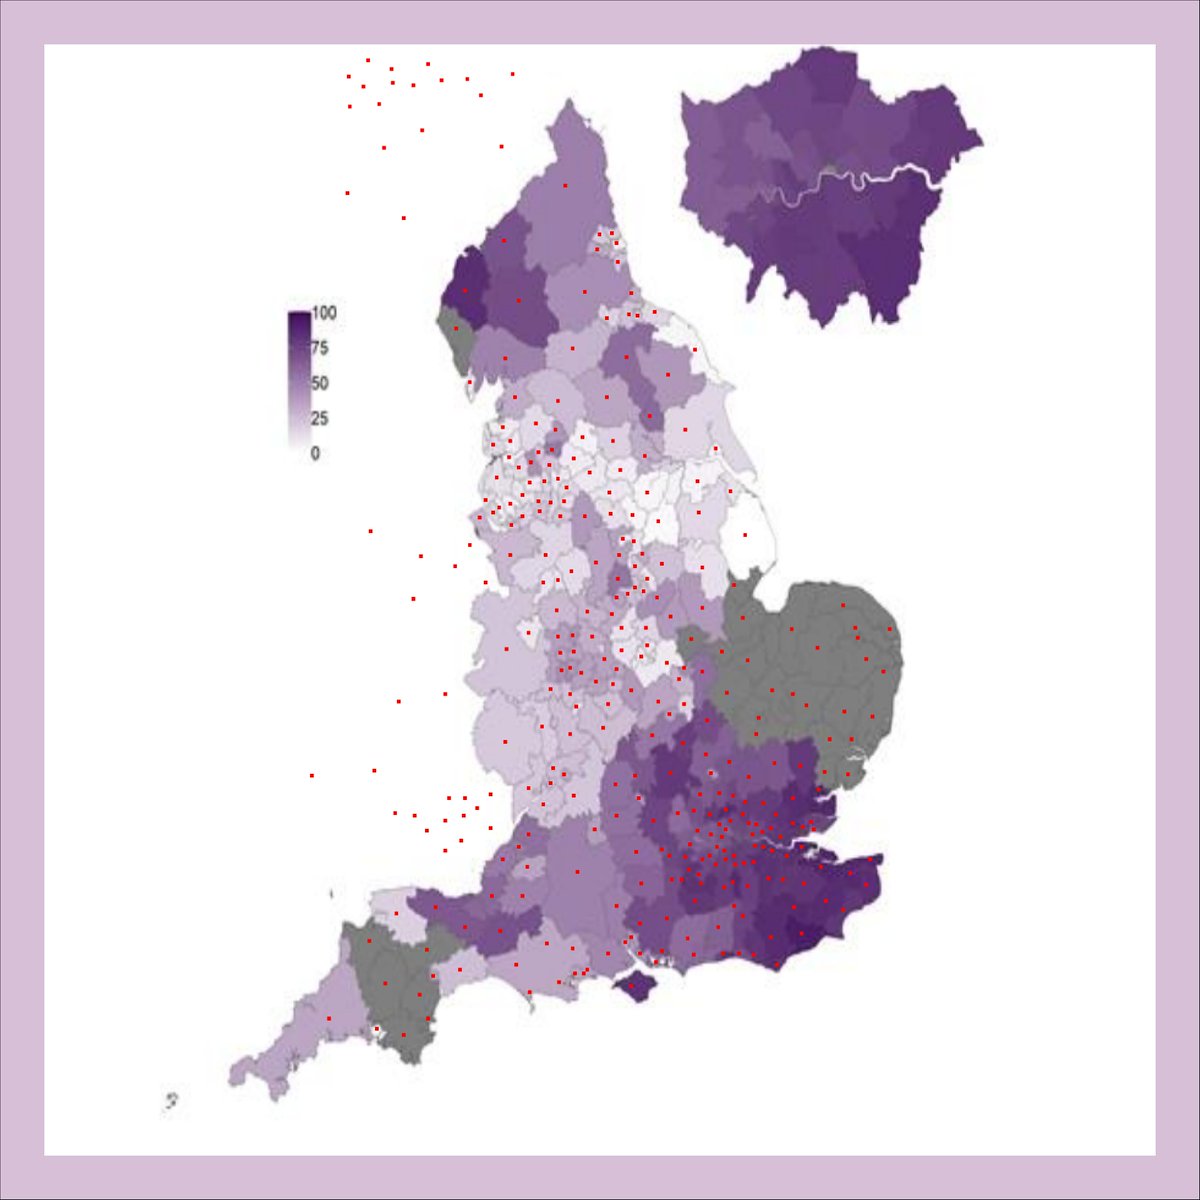
CSV output with the source: github.com/theosanderson/…
And we can then compare this to the rate of growth in case figures week-on-week. (N.B. the already published analysis from PHE and others does this in much better more sophisticated ways, it's just interesting to explore)
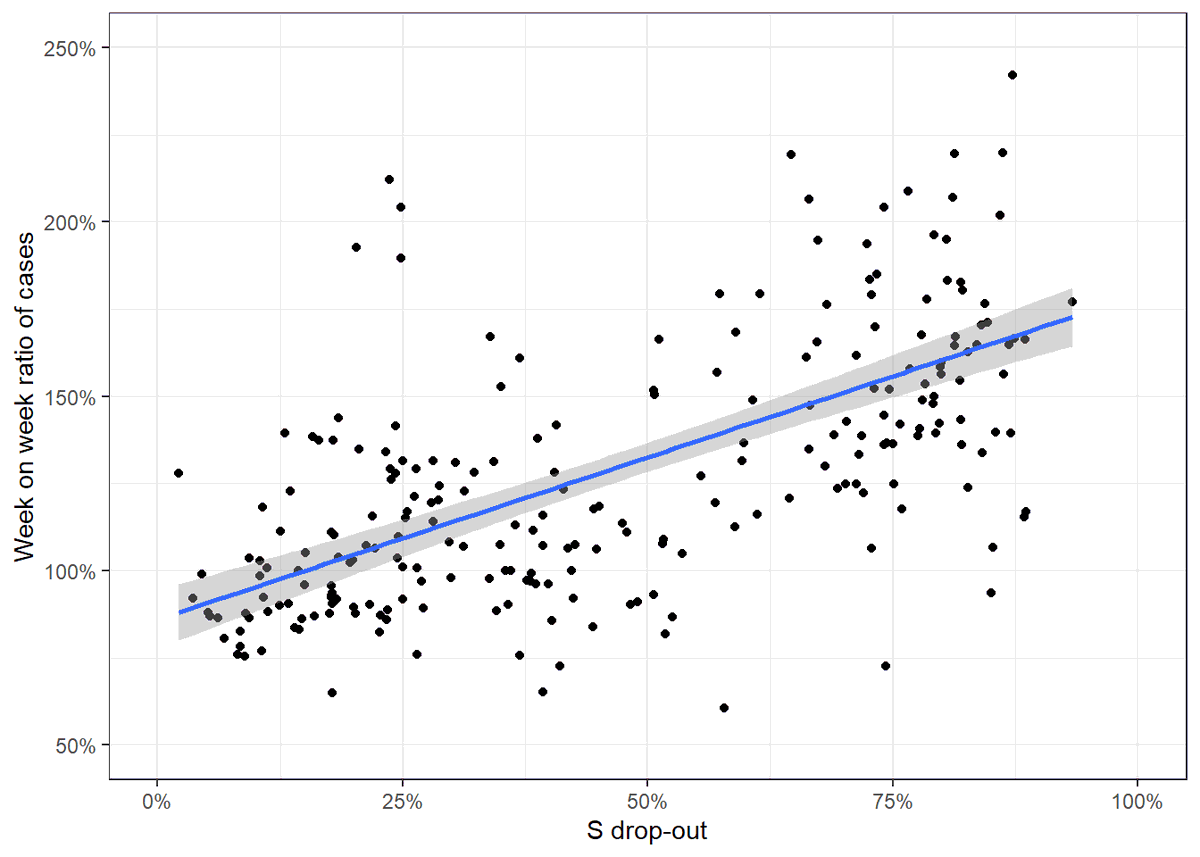
Actually looks like this went pretty well

• • •

Missing some Tweet in this thread? You can try to force a refresh
 

Keep Current with Theo Sanderson

Theo Sanderson Profile picture

Stay in touch and get notified when new unrolls are available from this author!

Read all threads

This Thread may be Removed Anytime!

PDF

Twitter may remove this content at anytime! Save it as PDF for later use!

Try unrolling a thread yourself!

how to unroll video
  1. Follow @ThreadReaderApp to mention us!

  2. From a Twitter thread mention us with a keyword "unroll"
@threadreaderapp unroll

Practice here first or read more on our help page!

More from @theosanderson

30 Dec
1/ The MHRA has approved a longer gap between doses for both the AstraZeneca vaccine and the Pfizer vaccine. The latter has concerned some people. Specifically many are citing a figure of 52% for protection after the first dose.

Here is why this 52% figure isn't useful [1/n] Image
2/ The 52% value is a real figure, which comes from the Pfizer trial, for the period between the first and second doses. Here is what that period of time looked like (fda.gov/media/144325/d…):

In red are people who received placebo and in blue are those who received the vaccine Image
3/ We can see that until day 3 we have near identical results in both groups. This is *expected* - no vaccine has an effect until days later when the immune system has had time to develop a response against it.
Read 10 tweets
28 Dec
1/ New PHE technical report on B.1.1.7 variant assets.publishing.service.gov.uk/government/upl…
2/ S dropout now appears a very good indication of B.1.1.7 in all regions.
3/ Roughly a third of swab tests are carried out with the TaqPath assay that serendipitously allows this S dropout detection of B.1.1.7.
Read 10 tweets
28 Dec
1/ We have two sources of information about the spread of the new variant. The most reliable is genomics data, but this has a lag period, and most samples can't be tested in this way.

The second is "S dropout", but it doesn't uniquely identify B.1.1.7

Graph below and short🧵
2/ B.1.1.7 has a deletion of 6 letters of RNA in the S gene, which happens to make one of the three PCR tests performed on each swab sample in the Lighthouse labs give a negative result. So these "S-negatives" can be a proxy for B.1.1.7.
3/ BUT there are other strains that also have this same "H69/70 deletion" variant. Indeed the first was seen in the UK in April, long before B1.1.7. The graph above shows these in blue. The graph represents the percentage of all genomes sequenced in these areas at various times.
Read 13 tweets
14 Dec
Any info out on the 'new strain' in phylogenetic / AA mutation terms?
Wonder if there's any chance increased circulation could be driven by false-negatives in testing. (happens in malaria with hrp2 deletion) Image
Read 19 tweets

Did Thread Reader help you today?

Support us! We are indie developers!


This site is made by just two indie developers on a laptop doing marketing, support and development! Read more about the story.

Become a Premium Member ($3/month or $30/year) and get exclusive features!

Become Premium

Too expensive? Make a small donation by buying us coffee ($5) or help with server cost ($10)

Donate via Paypal Become our Patreon

Thank you for your support!

Follow Us on Twitter!