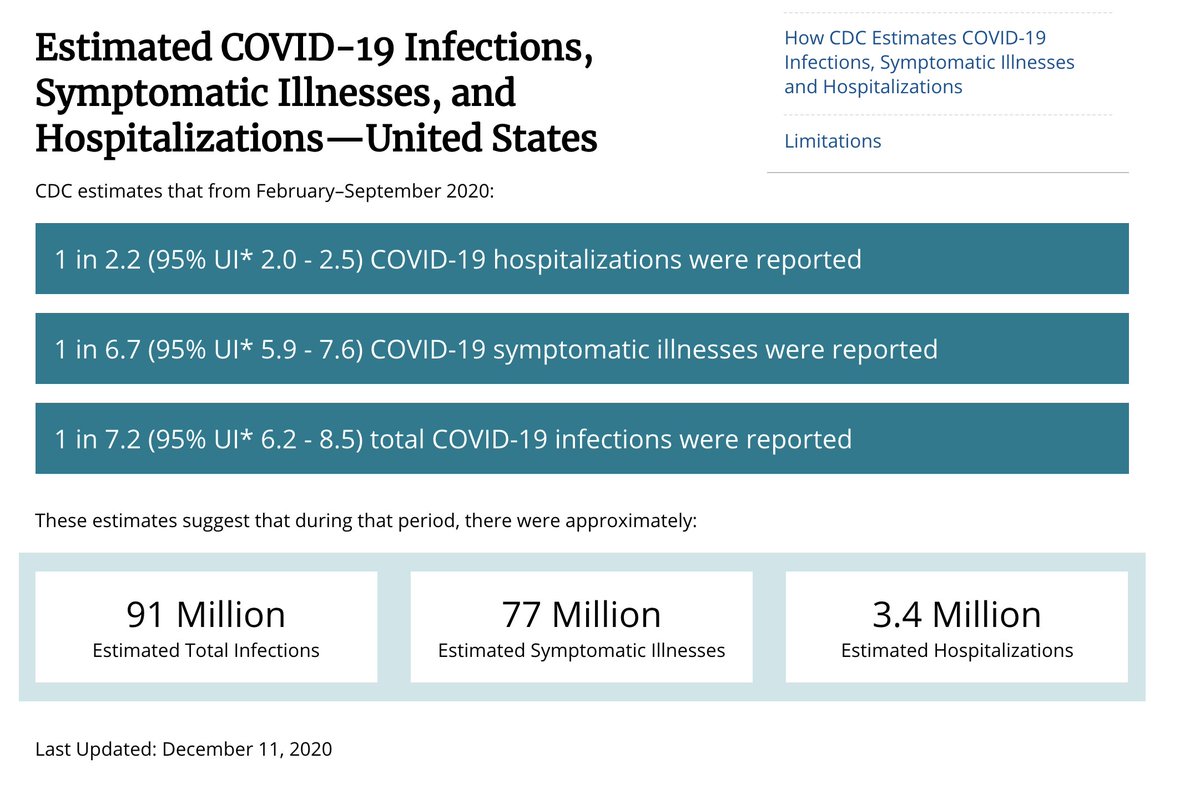
A lot of people have asked why the CDC estimates close to 100M total US COVID-19 infections (28%) by Dec 1, while covid19-projections.com only estimates 58M (17%).
I believe there are major flaws in the CDC estimates, which I will explain in this thread.
cdc.gov/coronavirus/20…
I believe there are major flaws in the CDC estimates, which I will explain in this thread.
cdc.gov/coronavirus/20…

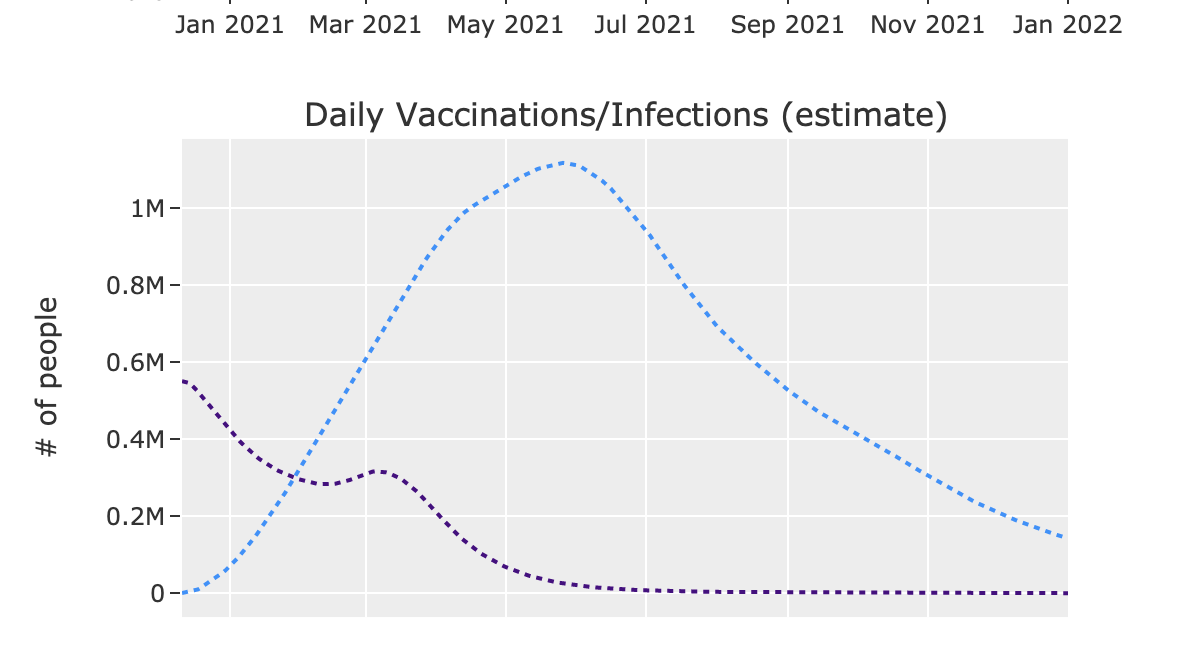
To begin, the covid19-projections.com model is tuned on serology surveys, while the CDC model is not.
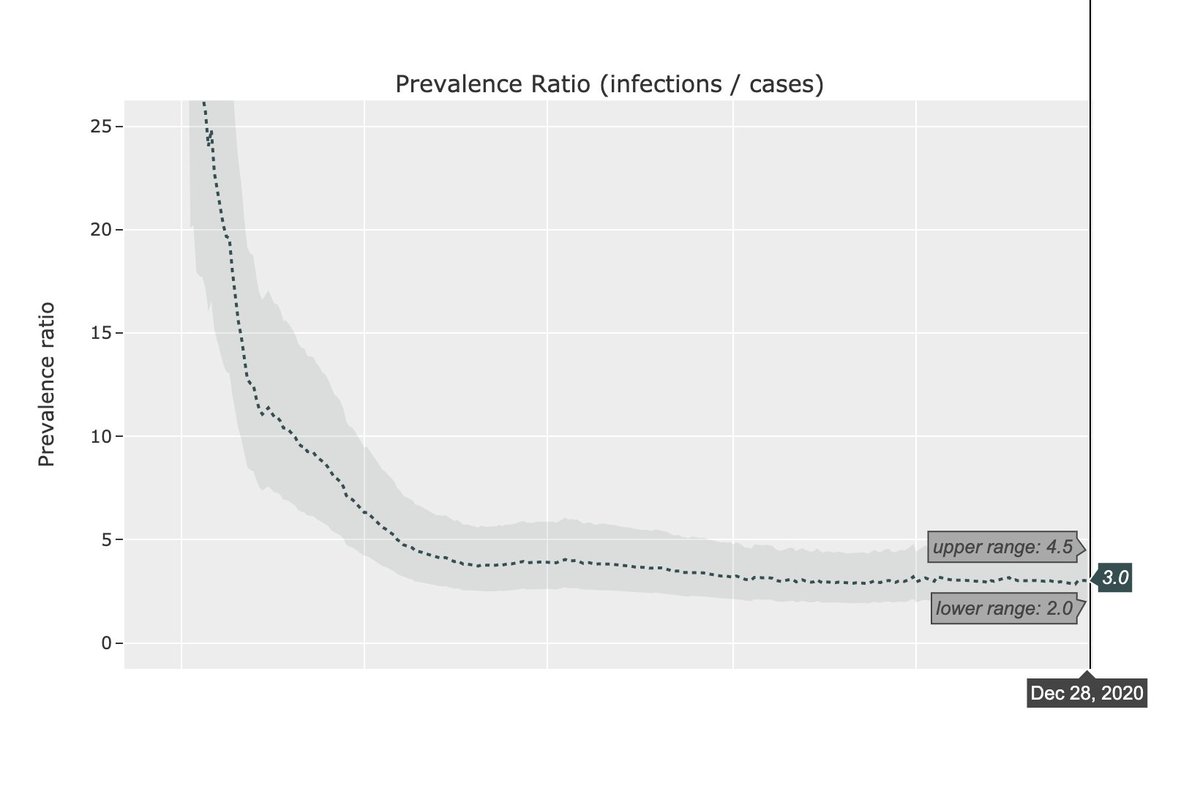
While CDC estimates 7x more COVID-19 infections than reported, covid19-projections.com estimates this ratio to currently be ~3x, down from 10x in April and 4x in the summer.
While CDC estimates 7x more COVID-19 infections than reported, covid19-projections.com estimates this ratio to currently be ~3x, down from 10x in April and 4x in the summer.
Using the CDC claim that "1 in 7 total infections were reported", this would imply that 70% of North & South Dakota were infected, which doesn't pass a common sense test.
While a 7x multiplier is believable in the spring, the paper still claims this is the case in September.
While a 7x multiplier is believable in the spring, the paper still claims this is the case in September.

The main issue with the CDC paper results lies with their estimate of non-hospitalized infections. Let's take a look.
They claim that 26-40% of non-hospitalized, symptomatic individuals sought care/testing. And out of those individuals, only 43-58% completed a COVID test.
They claim that 26-40% of non-hospitalized, symptomatic individuals sought care/testing. And out of those individuals, only 43-58% completed a COVID test.

First of all, the 26-40% of individuals that seek care is based off of a third-party data source called COVID Near You.
It is entirely self-reported, and over the past 3 weeks, only 402 people reported COVID-19 symptoms. In that time span, there were 4M cases. So coverage=0.01%.
It is entirely self-reported, and over the past 3 weeks, only 402 people reported COVID-19 symptoms. In that time span, there were 4M cases. So coverage=0.01%.

Next, the 43-58% test completion percentages are only based on *outpatient emergency department visits*.
The paper makes a questionable logic jump that *all* non-hospitalized symptomatic individuals who *already sought care/testing* complete tests at the same low 43-58% rate.
The paper makes a questionable logic jump that *all* non-hospitalized symptomatic individuals who *already sought care/testing* complete tests at the same low 43-58% rate.

We cannot use the testing completion percentage of emergency department visits as a proxy for the fraction of all symptomatic individuals who completes a COVID-19 test.
If my interpretation is correct, I believe this fundamental flaw compromises the result of the paper.
If my interpretation is correct, I believe this fundamental flaw compromises the result of the paper.
The paper's test completion percentage estimate is also based solely on a private dataset from IBM Explorys, making the results unreproducible.
It doesn't disclose how many data points were used to generate the estimates. For all we know, it could be 100 or 100,000.
It doesn't disclose how many data points were used to generate the estimates. For all we know, it could be 100 or 100,000.
Furthermore, the ranges for the test completion percentages are so wide they're practically meaningless.
For example, the paper claims the test completion percentage of non-hospitalized individuals between ages 18-49 can be anywhere between 6% and 99%. Not very helpful...
For example, the paper claims the test completion percentage of non-hospitalized individuals between ages 18-49 can be anywhere between 6% and 99%. Not very helpful...

To finish the calculation of computing the detection rate, the paper multiplies the care/test seeking rate with the test completion percentage, and factors in a ~11% false negative rate/0% false positive rate, to get a detection rate of ~15%, or 1 in 7 infections.
It appears that the CDC site used this 7x multiplier and applied it to the number of confirmed cases at end of November (13 million) to get 91 million total infected.
These estimates were then picked up and disseminated by the public & media (understandably, since it's the CDC).
These estimates were then picked up and disseminated by the public & media (understandably, since it's the CDC).
In reality, if an individual reported to have visited a testing center, the test completion percentage is likely close to 100%, not 43-58%.
Hence, the multiplier should be lowered by a factor of 2, from ~7 to ~3.5, making it consistent with the covid19-projections.com model.
Hence, the multiplier should be lowered by a factor of 2, from ~7 to ~3.5, making it consistent with the covid19-projections.com model.
The paper also claims that only 1 in every 2.5 COVID-19 hospitalizations are reported as COVID-19. Hence, they implicate that the majority of COVID-19 hospitalizations go unreported, even in September.
That also seems unlikely, but that is a separate discussion.
That also seems unlikely, but that is a separate discussion.

The entirety of these results hinges on data of unknown quality from two third-party data sources which is not available publicly and thus irreproducible.
Furthermore, one of the data sources is composed entirely of self-reported data from an online, non-random population.
Furthermore, one of the data sources is composed entirely of self-reported data from an online, non-random population.
If my interpretation is correct, I'm surprised this paper passed peer review and is now featured on the CDC website.
These results have major problematic implications. E.g:
- A much lower IFR (0.4%)
- 40% total infected currently (50% by February)
These results have major problematic implications. E.g:
- A much lower IFR (0.4%)
- 40% total infected currently (50% by February)
Even though some people want to believe in those implications, they are likely not true, at least based on the current data
I hope this adds more clarity to why covid19-projections.com estimates differ from the CDC. If new evidence comes to light, I will adjust accordingly.
I hope this adds more clarity to why covid19-projections.com estimates differ from the CDC. If new evidence comes to light, I will adjust accordingly.
With all the resources, data, & expertise at the disposal of the CDC, I hope to see more sophisticated methods used to estimate the true prevalence of COVID-19 in the US.
Ideally it would take advantage of all the serology surveys that the CDC has done: cdc.gov/coronavirus/20…
Ideally it would take advantage of all the serology surveys that the CDC has done: cdc.gov/coronavirus/20…
With all that said, the CDC has some of the world's brightest scientists and experts. I learned a lot from their work over the past year.
As with all science, new findings should be scrutinized and held to the same rigorous standards. That's always been my goal.
As with all science, new findings should be scrutinized and held to the same rigorous standards. That's always been my goal.
• • •
Missing some Tweet in this thread? You can try to
force a refresh