Our daily update is published. States reported 1.6 million tests, 226k cases, a record 125,220 hospitalizations, and a record 3,903 COVID-19 deaths. Holiday reporting delays are still markedly affecting testing, case, and deaths figures. 4 bar charts showing key COVID-19 metrics for the US over ti
Today's record death count includes a backlog of "roughly 200" deaths reported in WA. Even without this backlog, today's total would still be the highest to date. Chart showing daily reported deaths since March 1, 2020, alo
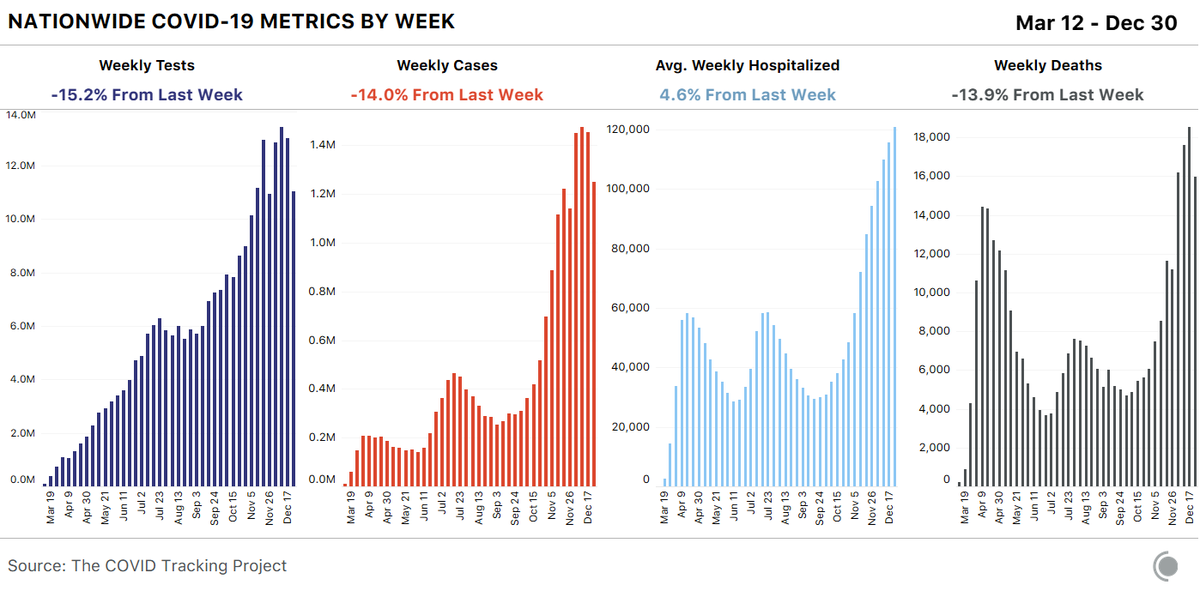
The 7-day average for current hospitalizations is now close to 121k.
Louisiana reported a record 6,754 COVID-19 cases today. The state department of health notes that this does not include a backlog of cases or multiple days of reporting.
We continue to urge caution when interpreting current figures and trends in COVID-19 data. We also expect ongoing disruptions in reporting with the New Year holiday weekend.

• • •

Missing some Tweet in this thread? You can try to force a refresh
 

Keep Current with The COVID Tracking Project

The COVID Tracking Project Profile picture

Stay in touch and get notified when new unrolls are available from this author!

Read all threads

This Thread may be Removed Anytime!

PDF

Twitter may remove this content at anytime! Save it as PDF for later use!

Try unrolling a thread yourself!

how to unroll video
  1. Follow @ThreadReaderApp to mention us!

  2. From a Twitter thread mention us with a keyword "unroll"
@threadreaderapp unroll

Practice here first or read more on our help page!

More from @COVID19Tracking

1 Jan
Our daily update is published. States reported 1.7 million tests, 221k cases, a record 125,379 people hospitalized, and 3,255 COVID-19 deaths. Four charts, showing the da...
Holiday reporting delays are still markedly affecting testing, case, and deaths figures. Of our four topline metrics, only hospitalizations counts remain relatively stable through holiday data disruptions.

covidtracking.com/analysis-updat… Map showing the number of p...
Even with all the data pipeline disruptions, every week in December saw more deaths from COVID-19 than any week earlier in the year. December was the deadliest month of the pandemic by far. The 76,580 reported deaths in the month surpassed the heights of April (55,267). 4 bar charts showing tests,...
Read 4 tweets
26 Dec 20
Our daily update is published. States reported 1.3 million tests, 124k cases, and 1,541 deaths. There are nearly 119 thousand people hospitalized with COVID-19.

The numbers are strongly affected by holiday reporting.
20 states provided no update: AK, CA, CT, DC, ID, KS, KY, LA, MA, MI, MN, MP, NC, ND, NH, OH, RI, SC, SD, UT, VT.

7 other states made partial updates.
We'd also like to recognize the shift leaders who have carried us through the holidays: Hannah Hoffman and Brian S.-K. Li.

They are brilliant and dedicated. We could not thank them enough.
Read 4 tweets
25 Dec 20
Our daily update is published. States reported 1.9 million tests, 203k cases, and 2,938 deaths. There are a record 120,151 COVID-19 patients currently hospitalized. 4 bar charts showing key COVID-19 metrics for the US over ti
The majority of states that updated their data today reported more than 500 new cases per million residents. Twenty reported a higher number of cases per capita than New York had at its spring peak. A hex map of the new cases reported by states. Arkansas is r
The Midwest, and more recently the West, are showing a declining number of average deaths each day. Chart showing the daily new deaths reported for each of the
Read 4 tweets
24 Dec 20
Our weekly update is published. With more than a week remaining, states have reported more deaths in December than in any other month.
covidtracking.com/analysis-updat…
New cases and current hospitalizations are declining in the Midwest, a hopeful sign. 4 bar charts with 7-day average lines overlaid, showing new
Cases are rising sharply in California and several states in the South. Nearly 300k new cases have been reported in California in the past week; 56% of all cases in California during the pandemic have been among Latinx people. Stacked bar chart showing COVID-19 cases by week for the US.
Read 5 tweets
23 Dec 20
Our daily update is published. States reported 1.7 million tests, 221k cases, and 3,379 deaths. There are a record 119,463 COVID-19 patients currently hospitalized. 4 bar charts showing key COVID-19 metrics for the US over ti
The 7-day average for hospitalizations is at a record 115k. bar chart of US COVID-19 currently hospitalized over time. D
With 8 days remaining in the month, December has already proven to be the most deadly during the pandemic. Bar chart showing monthly US deaths from COVID-19. December
Read 6 tweets
23 Dec 20
Our daily update is published. States reported 1.7 million tests, 189k cases, and 3,131 deaths. There are 117,777 COVID-19 patients currently hospitalized. 4 bar charts showing key COVID-19 metrics for the US over ti
California is now reporting so many cases that it has kept the country on a case plateau, even as the Midwest declines bring the rest of the country's cases down.
But this view masks the seriousness of the situation in the three largest southern states. Hospitalizations are rapidly rising in Texas, Florida, and Georgia.
Read 5 tweets

Did Thread Reader help you today?

Support us! We are indie developers!


This site is made by just two indie developers on a laptop doing marketing, support and development! Read more about the story.

Become a Premium Member ($3/month or $30/year) and get exclusive features!

Become Premium

Too expensive? Make a small donation by buying us coffee ($5) or help with server cost ($10)

Donate via Paypal Become our Patreon

Thank you for your support!

Follow Us on Twitter!