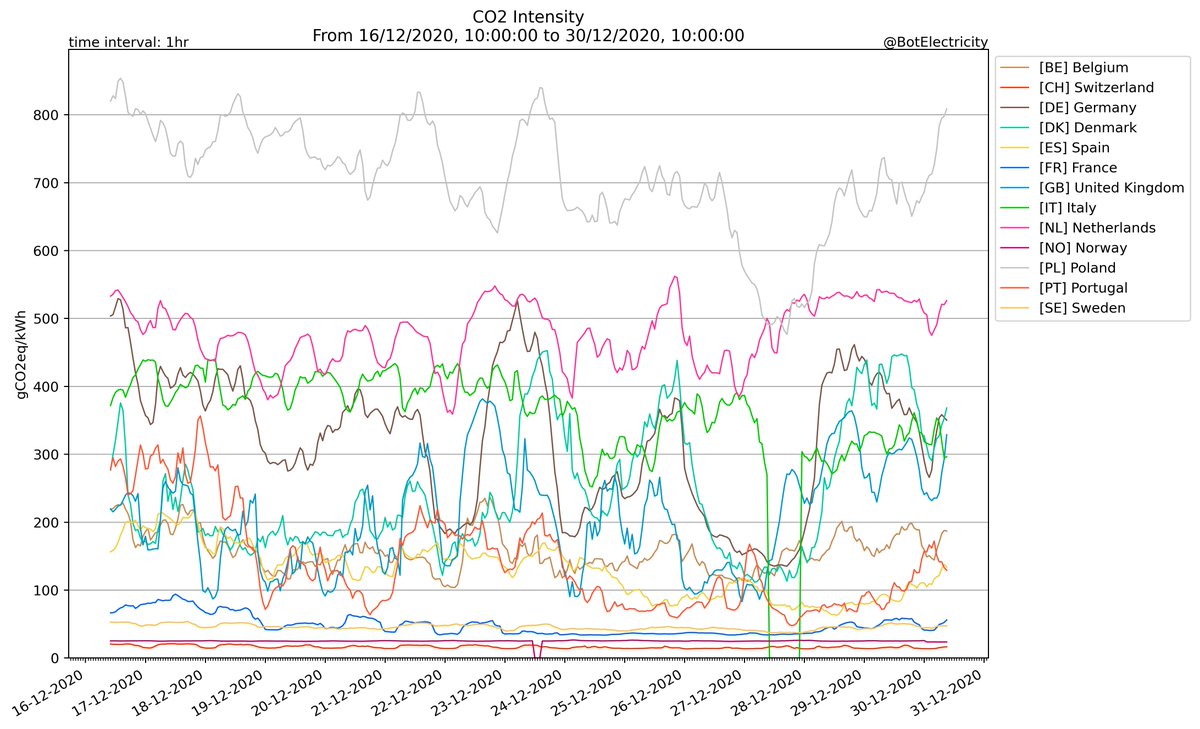
Stats for the country : [All] All countries
From ENTSO-E and IPCC 2014 ImageImageImage
Stats for the country : [BE] Belgium
From ENTSO-E and IPCC 2014 ImageImageImage
Stats for the country : [CH] Switzerland
From ENTSO-E and IPCC 2014 ImageImageImage
Stats for the country : [DE] Germany
From ENTSO-E and IPCC 2014 ImageImageImage
Stats for the country : [DK] Denmark
From ENTSO-E and IPCC 2014 ImageImageImage
Stats for the country : [ES] Spain
From ENTSO-E and IPCC 2014 ImageImageImage
Stats for the country : [FR] France
From ENTSO-E and IPCC 2014 ImageImageImage
Stats for the country : [GB] United Kingdom
From ENTSO-E and IPCC 2014 ImageImageImage
Stats for the country : [IT] Italy
From ENTSO-E and IPCC 2014 ImageImageImage
Stats for the country : [NL] Netherlands
From ENTSO-E and IPCC 2014 ImageImageImage
Stats for the country : [NO] Norway
From ENTSO-E and IPCC 2014 ImageImageImage
Stats for the country : [PL] Poland
From ENTSO-E and IPCC 2014 ImageImageImage
Stats for the country : [PT] Portugal
From ENTSO-E and IPCC 2014 ImageImageImage
Stats for the country : [SE] Sweden
From ENTSO-E and IPCC 2014 ImageImageImage

• • •

Missing some Tweet in this thread? You can try to force a refresh
 

Keep Current with BotElectricity

BotElectricity Profile picture

Stay in touch and get notified when new unrolls are available from this author!

Read all threads

This Thread may be Removed Anytime!

PDF

Twitter may remove this content at anytime! Save it as PDF for later use!

Try unrolling a thread yourself!

how to unroll video
  1. Follow @ThreadReaderApp to mention us!

  2. From a Twitter thread mention us with a keyword "unroll"
@threadreaderapp unroll

Practice here first or read more on our help page!

More from @BotElectricity

2 Jan
For 2020

Production (MWh) compared to CO2 intensity (gCO2eq/kWh)

#GHG #MWh #CO2 ImageImage
Production (MWh), Load (MWh), CO2 intensity (gCO2eq/kWh), CO2 emission (tCO2/h) ImageImageImageImage
Production (MWh), Load (MWh), CO2 intensity (gCO2eq/kWh), CO2 emission (tCO2/h) per months (average) ImageImageImageImage
Read 6 tweets
31 Dec 20
Energy production (#MWh) per country and #CO2 (#GHG) Intensity and Emission
From ENTSO-E and IPCC 2014 ImageImageImageImage
CO2 Intensity compared to power production
Size of the square represent CO2 Emissions
From ENTSO-E and IPCC 2014 Image
Balance (#MWh) per country
From ENTSO-E and IPCC 2014 Image
Read 21 tweets

Did Thread Reader help you today?

Support us! We are indie developers!


This site is made by just two indie developers on a laptop doing marketing, support and development! Read more about the story.

Become a Premium Member ($3/month or $30/year) and get exclusive features!

Become Premium

Too expensive? Make a small donation by buying us coffee ($5) or help with server cost ($10)

Donate via Paypal Become our Patreon

Thank you for your support!

Follow Us on Twitter!