Fascinating new paper by @AndrewDessler and colleagues arguing committed warming might be higher than expected given historical pattern effects. Its combining a lot of different concepts together, so lets spend some time disentangling them nature.com/articles/s4155…
A thread: 1/19
A thread: 1/19
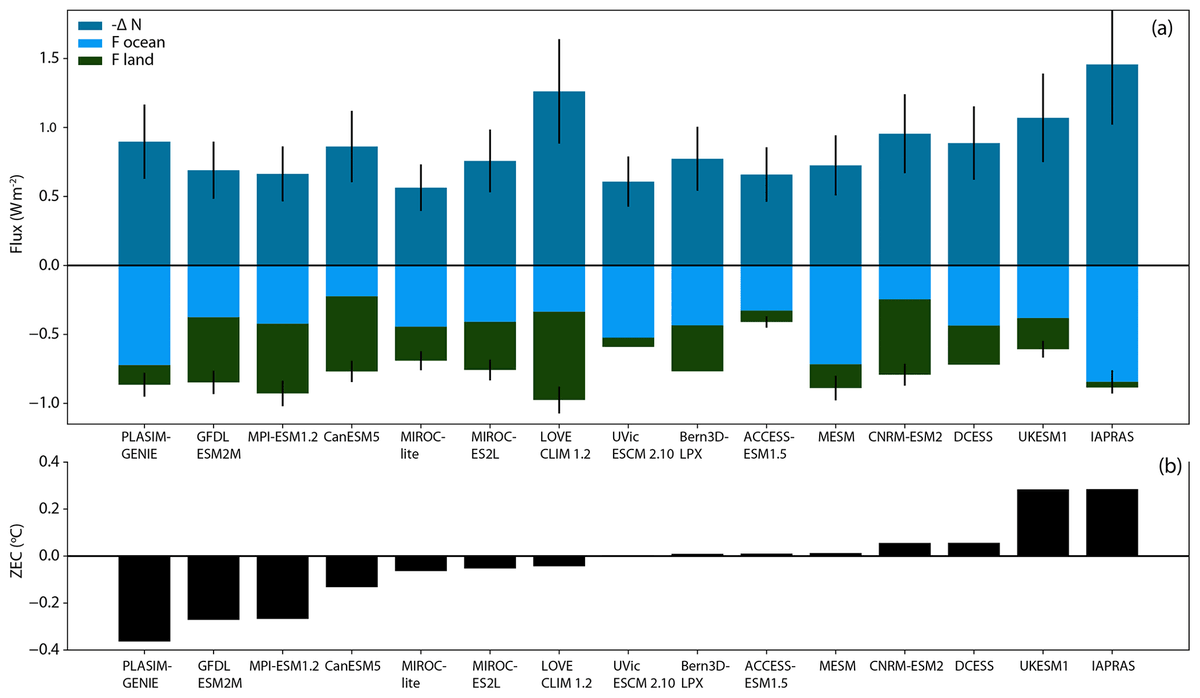
The paper's headline number is that we previously thought the world was committed to 1.3C warming, but that number is actually over 2C (> 1.5C by 2100). This is quite a different message than we get from Earth System Models, which suggest committed warming is only ~1.2C. 2/19
This would imply that the 1.5C by 2100 target is effectively impossible, and that long-term warming of >2C would be very difficult to avoid. However, the devil is in the details, and the picture is not quite as dire as it would seem at first glance. 3/19
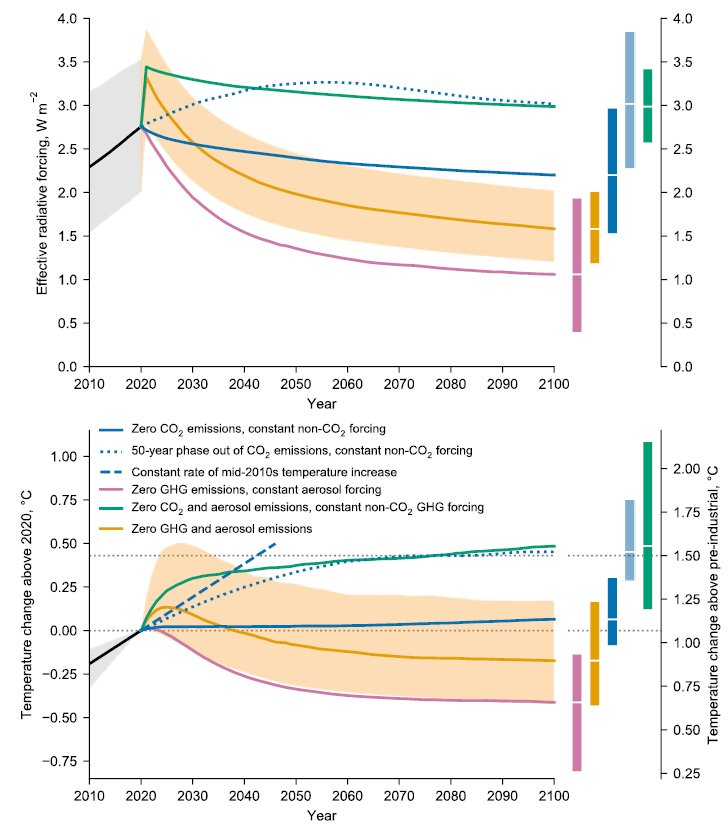
When we talk about "committed warming" folks are generally talking about one of two scenarios: either constant CO2 and other GHG concentrations (and forcings), or getting all emissions (or just CO2 emissions) down to zero immediately. 4/19
In the first method – constant concentrations – we find that the world warms up another 0.5C or so, as the oceans continue to take up heat as more energy is being trapped by greenhouse gases than is being emitted back to space. Much of this additional warming happens by 2100 5/19
In the second method – zero emissions – atmospheric concentrations of CO2 start to fall, as the ocean and land continue taking up some of the CO2 that humans have previously emitted. 6/19
(short-lived greenhouse gases like methane are also quickly removed from the atmosphere, but so are short-lived aerosols that tend to cool the planet. To a first order approximation these cancel eachother out, though there are some temporal differences). 7/19
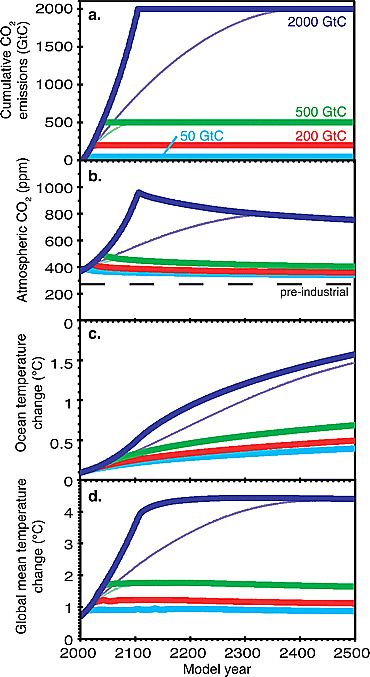
Falling atmospheric CO2 causes enough cooling to balance out the warming "in the pipeline" due to slow ocean heat uptake, and global temperatures remain relatively flat after net-zero emissions are reached. 8/19 

This flat-temperatures-at-zero-emissions finding is quite robust, first appearing in Matthews and Caldeira in 2008, highlighted in the IPCC SR15, and more recently being found in 18 different Earth System Models in the CMIP6 ZECMIP: bg.copernicus.org/articles/17/29… 9/19 

What Dessler and colleagues look at in the new paper is the constant concentration scenario rather than the zero emission scenario, so its hard to directly compare the two. 10/19
Furthermore, their two numbers (1.3C vs 2C+ committed warming) conflate two different factors: higher climate sensitivity and changing warming patterns over time. 11/19
Modern climate models expect more then 1.3C warming at equilibrium in a constant concentration scenario. Rather, at 2.2 w/m^2 constant forcing they would expect around 1.7C warming (assuming a 3C ECS). 12/19
The 1.3C number in the paper is based on an observational-derived ECS of ~2C per doubling CO2, while the > 2C number is based on a revised ECS estimate of ~3.5C plus warming due to pattern effects. 13/19
Pattern effects themselves are a bit complicated. In short, climate models expect both the Western and Eastern Pacific Ocean to have similar rates of long-term warming. However, in the real world the Western Pacific is warming a lot faster than the Eastern. 14/19
Warming in the western Pacific tends to generate a lot more low-altitude clouds that reflect light back to space and cool the surface, while warming in the Eastern Pacific does not. This warming pattern is likely due to natural variability and may not persist in the future. 15/19
If the warming pattern in the Pacific changes to be more similar to that in climate models, Dessler and colleagues argue that it would result in between ~0.3 and ~0.6 w/m^2 additional radiative forcing (or 0.2C to 0.5C more warming, assuming 3C ECS). 16/19
So, in essence, Dessler and colleagues results would suggest that the world could warm 0.2C to 0.5C more under our best estimate of ECS even in a zero emissions scenario due to pattern effect changes. 17/19
However, not all of this warming would happen by 2100 (indeed, we really don't know when the Pacific warming pattern might shift!). The impact on meeting Paris Agreement goals would be smaller, though exactly how much depends on when the warming pattern changes. 18/19
I don't think this paper fundamentally changes our understanding of committed warming, and pattern effects are still an area of active research. But it should make us a bit cautious about being too confident in predictions of zero warming after emissions reach net-zero. 19/19
• • •
Missing some Tweet in this thread? You can try to
force a refresh


