Nirav B Profile picture
8 Jan, 4 tweets, 2 min read
Daily Cases (7-day avg):

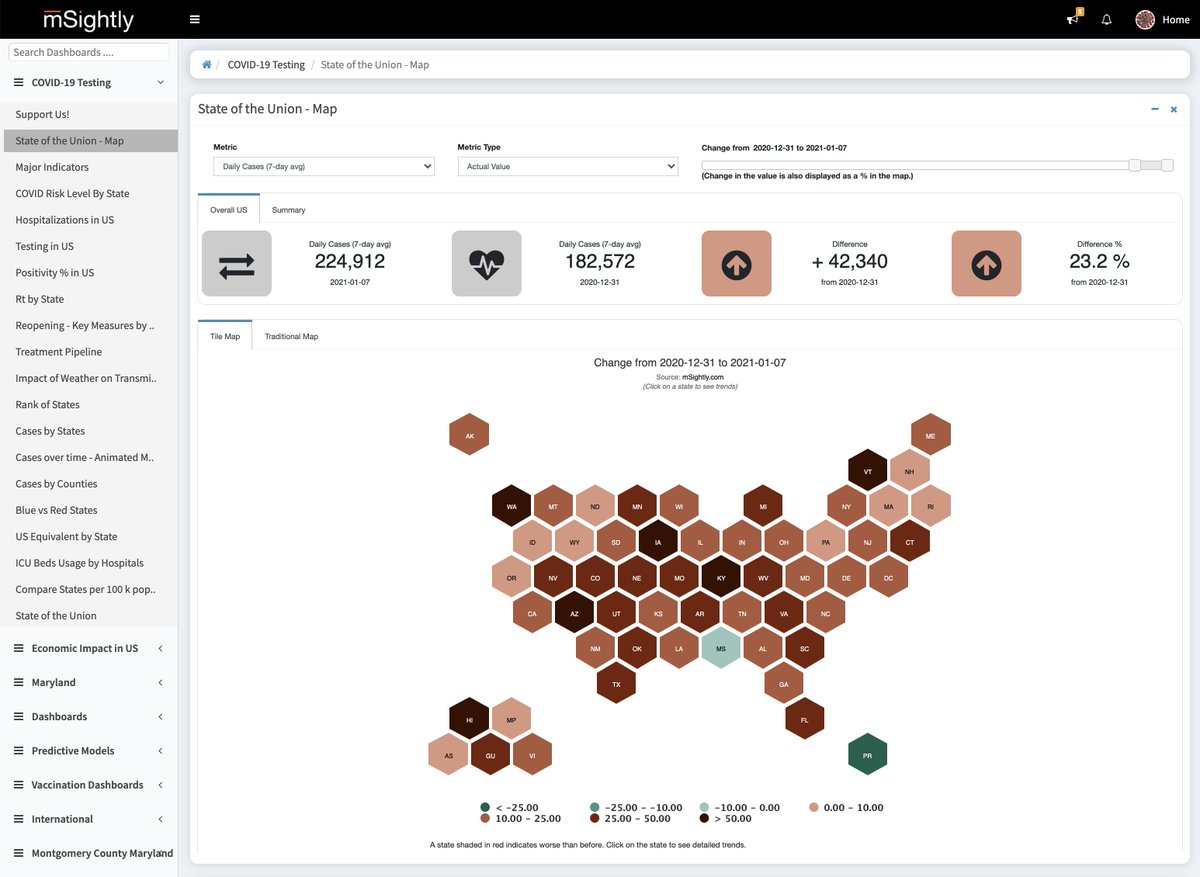
52 states and/or territories reported increase between 2020-12-31 and 2021-01-07.

On 2021-01-07, it was 224,912 ; up by + 42,340 (23.2 %) from 2020-12-31 when 182,572 were reported.

msightly.com/covid-19/detai…
Daily Fatalities (7-day avg):

40 states and/or territories reported increase between 2020-12-31 and 2021-01-07.

On 2021-01-07, it was 2,752 ; up by + 436 (18.8 %) from 2020-12-31 when 2,316 were reported.

msightly.com/covid-19/detai…
Daily Tests (7-day avg):

40 states and/or territories reported increase between 2020-12-31 and 2021-01-07.

On 2021-01-07, it was 1,654,700 ; up by + 99,423 (6.4 %) from 2020-12-31 when 1,555,277 were reported.

msightly.com/covid-19/detai…
Positivity %:

34 states have positivity above 10%.

msightly.com/covid-19/detai…

• • •

Missing some Tweet in this thread? You can try to force a refresh
 

Keep Current with Nirav B

Nirav B Profile picture

Stay in touch and get notified when new unrolls are available from this author!

Read all threads

This Thread may be Removed Anytime!

PDF

Twitter may remove this content at anytime! Save it as PDF for later use!

Try unrolling a thread yourself!

how to unroll video
  1. Follow @ThreadReaderApp to mention us!

  2. From a Twitter thread mention us with a keyword "unroll"
@threadreaderapp unroll

Practice here first or read more on our help page!

More from @niravb

8 Jan
Daily Updates (01/07)

Cases: 266.2 k (LW: 223.7 k)
7-day avg: 224932 (LW: 182589)

Deaths: 4,033 (LW: 3,287)
7-day avg: 2774 (LW: 2336)

Hospitalization: 132,370 (LW: 125,379)
ICU: 23,821

Avg positivity: 13.59%

dashboards4good.com/details.php?do…
Daily Updates (01/07) : California

Cases: 36.4 k (LW: 27.2 k)
7-day avg: 39033 (LW: 34605)

Deaths: 583 (LW: 428)
7-day avg: 380 (LW: 250)

Hospitalization: 22,851 (LW: 21,449)
ICU: 4,811

Avg positivity: 14.34%

#mSightly #COVID19 #COVID_19

dashboards4good.com/details.php?do…
Daily Updates (01/07) : Texas

Cases: 24.6 k (LW: 18.7 k)
7-day avg: 19367 (LW: 14664)

Deaths: 393 (LW: 349)
7-day avg: 214 (LW: 176)

Hospitalization: 13,784 (LW: 12,268)
ICU: 3,502

Avg positivity: 19.29%

#mSightly #COVID19 #COVID_19

dashboards4good.com/details.php?do…
Read 6 tweets
7 Jan
Daily Updates (01/06)

Cases: 243.3 k (LW: 226.3 k)
7-day avg: 218220 (LW: 179817)

Deaths: 3,793 (LW: 3,903)
7-day avg: 2657 (LW: 2287)

Hospitalization: 132,476 (LW: 125,218)
ICU: 23,707

Avg positivity: 13.39%

dashboards4good.com/details.php?do… Image
Daily Updates (01/06) : California

Cases: 29.9 k (LW: 30.9 k)
7-day avg: 37726 (LW: 36295)

Deaths: 459 (LW: 432)
7-day avg: 358 (LW: 239)

Hospitalization: 22,820 (LW: 21,433)
ICU: 4,731

Avg positivity: 13.71%

#mSightly #COVID19 #COVID_19

dashboards4good.com/details.php?do… Image
Daily Updates (01/06) : Texas

Cases: 24.0 k (LW: 21.5 k)
7-day avg: 18531 (LW: 14427)

Deaths: 326 (LW: 326)
7-day avg: 208 (LW: 170)

Hospitalization: 13,628 (LW: 11,992)
ICU: 3,477

Avg positivity: 18.31%

#mSightly #COVID19 #COVID_19

dashboards4good.com/details.php?do… Image
Read 6 tweets
5 Jan
Daily Cases (7-day avg):

52 states and/or territories reported increase between 2020-12-29 and 2021-01-05.

On 2021-01-05, it was 215,608 ; up by + 36,495 (20.4 %) from 2020-12-29 when 179,113 were reported.

msightly.com/covid-19/detai… Image
Daily Fatalities (7-day avg):

42 states and/or territories reported increase between 2020-12-29 and 2021-01-05.

On 2021-01-05, it was 2,641 ; up by + 451 (20.6 %) from 2020-12-29 when 2,190 were reported.

msightly.com/covid-19/detai… Image
Daily Tests (7-day avg):

33 states and/or territories reported increase between 2020-12-29 and 2021-01-05.

On 2021-01-05, it was 1,621,300 ; up by + 9,175 (0.6 %) from 2020-12-29 when 1,612,125 were reported.

msightly.com/covid-19/detai… Image
Read 5 tweets
5 Jan
Daily Updates (01/05)

Cases: 214.4 k (LW: 195.9 k)
7-day avg: 215632 (LW: 179135)

Deaths: 3,478 (LW: 3,299)
7-day avg: 2666 (LW: 2212)

Hospitalization: 131,195 (LW: 124,693)
ICU: 23,509

Avg positivity: 13.30%

dashboards4good.com/details.php?do… ImageImage
Daily Updates (01/05) : California

Cases: 31.4 k (LW: 31.2 k)
7-day avg: 37873 (LW: 37459)

Deaths: 368 (LW: 242)
7-day avg: 354 (LW: 229)

Hospitalization: 22,485 (LW: 21,240)
ICU: 4,734

Avg positivity: 13.55%

#mSightly #COVID19 #COVID_19

dashboards4good.com/details.php?do… Image
Daily Updates (01/05) : Texas

Cases: 31.6 k (LW: 32.6 k)
7-day avg: 18168 (LW: 14698)

Deaths: 250 (LW: 241)
7-day avg: 208 (LW: 165)

Hospitalization: 13,308 (LW: 11,775)
ICU: 3,356

Avg positivity: 18.22%

#mSightly #COVID19 #COVID_19

dashboards4good.com/details.php?do… Image
Read 6 tweets
25 Dec 20
Daily Cases (7-day avg):

14 states and/or territories reported increase between 2020-12-17 and 2020-12-24.

On 2020-12-24, it was 203,748 ; down by -10,392 (-4.9 %) from 2020-12-17 when 214,140 were reported.

msightly.com/covid-19/detai…
Daily Fatalities (7-day avg):

22 states and/or territories reported increase between 2020-12-17 and 2020-12-24.

On 2020-12-24, it was 2,575 ; up by + 37 (1.5 %) from 2020-12-17 when 2,538 were reported.

msightly.com/covid-19/detai…
Daily Tests (7-day avg):

18 states and/or territories reported increase between 2020-12-17 and 2020-12-24.

On 2020-12-24, it was 1,877,382 ; down by -4,000 (-0.2 %) from 2020-12-17 when 1,881,382 were reported.

msightly.com/covid-19/detai…
Read 5 tweets
25 Dec 20
Summary (12/24)

New Cases
199,375
Total: 18,438,225
7-day Avg: 203,772

New Deaths
2,908
Total: 326,161
7-day Avg: 2,594

Currently Hospitalized
120,168
ICU: 22,587
Ventilator: 7,780

New Tests
1,449,314
Positivity : 13.8%
7-day avg: 13.4%

msightly.com/covid-19/detai…
Daily Updates (12/24) : California

Cases: 39.1 k (LW: 52.3 k)
7-day avg: 39969 (LW: 39018)

Deaths: 351 (LW: 379)
7-day avg: 254 (LW: 200)

Hospitalization: 19,771 (LW: 16,426)
ICU: 4,069

Avg positivity: 12.09%

#mSightly #COVID19 #COVID_19

dashboards4good.com/details.php?do…
Daily Updates (12/24) : Texas

Cases: 17.1 k (LW: 19.8 k)
7-day avg: 16333 (LW: 15091)

Deaths: 308 (LW: 266)
7-day avg: 221 (LW: 191)

Hospitalization: 10,724 (LW: 9,628)
ICU: 2,865

Avg positivity: 16.51%

#mSightly #COVID19 #COVID_19

dashboards4good.com/details.php?do…
Read 6 tweets

Did Thread Reader help you today?

Support us! We are indie developers!


This site is made by just two indie developers on a laptop doing marketing, support and development! Read more about the story.

Become a Premium Member ($3/month or $30/year) and get exclusive features!

Become Premium

Too expensive? Make a small donation by buying us coffee ($5) or help with server cost ($10)

Donate via Paypal Become our Patreon

Thank you for your support!

Follow Us on Twitter!