Our daily update is published. States reported 1.8M tests, 219k cases, 130,383 people currently hospitalized with COVID-19, and 4,022 deaths. 4 bar charts showing key COVID-19 metrics for the US over ti
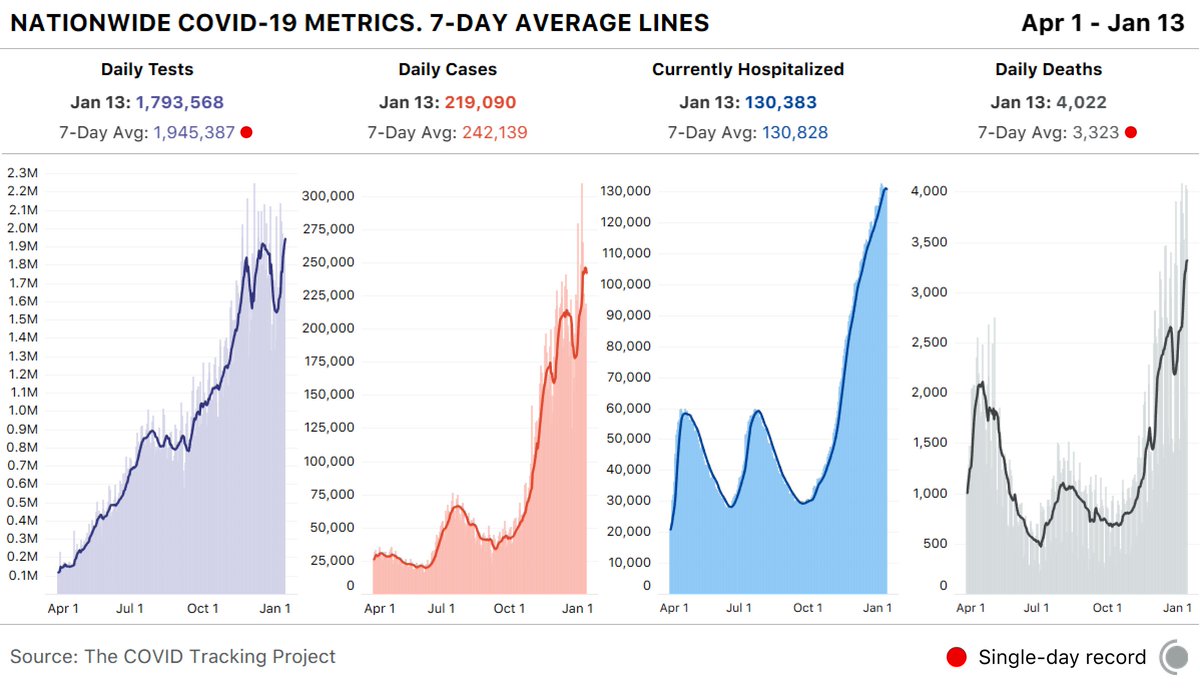
COVID-19 deaths are up by 10% or more in 25 states across the US. Today is the third time deaths have been above 4,000. Block map of US states showing change in 7-day average death
Starting today, we will be capturing Oregon’s data the day after it is published, as they regularly update their COVID-19 pages and dashboards after we release our daily update. We have shifted their entire timeseries accordingly.
Today we have removed most state-level “recovered” data from our website, though the values remain in our API and will continue to be updated. We have shifted to reporting only hospital discharges for the 8 states that report this metric.
We have taken this step because “recovered” values are largely estimates of non-infectiousness that do not account for the fact that many people suffer long-term health consequences after contracting COVID-19, and because no two states define the metric in the same way.
Unfortunately, we just don’t know how many people have recovered from COVID-19, and in the absence of national data standards, we might never know. Read more about these issues at covidtracking.com/analysis-updat…

• • •

Missing some Tweet in this thread? You can try to force a refresh
 

Keep Current with The COVID Tracking Project

The COVID Tracking Project Profile picture

Stay in touch and get notified when new unrolls are available from this author!

Read all threads

This Thread may be Removed Anytime!

PDF

Twitter may remove this content at anytime! Save it as PDF for later use!

Try unrolling a thread yourself!

how to unroll video
  1. Follow @ThreadReaderApp to mention us!

  2. From a Twitter thread mention us with a keyword "unroll"
@threadreaderapp unroll

Practice here first or read more on our help page!

More from @COVID19Tracking

15 Jan
States reported 2 million tests, 223k cases, 128,947 people currently hospitalized with COVID-19, and 3,915 deaths. 4 bar charts showing key CO...
After holiday disruptions, our core metrics stabilize at different rates. We believe the bulk of holiday-related case and death backlogs have been reported, but that we're only now seeing a lot of the test backlogs, hence today's new 7-day average record.
As the data normalizes, the U.S. is still reporting more than 200,000 cases and 3,000 deaths per day. These are the highest levels of the pandemic.
Read 9 tweets
14 Jan
A month since COVID-19 vaccine distribution began, it is still impossible for the public and the media to track the rollout of vaccines in nursing homes, assisted living facilities, and other long-term-care facilities in most states.

covidtracking.com/analysis-updat…
As a reminder, less than 1 percent of US residents live in long-term-care facilities—but they make up at least 37% of the nation’s total COVID-19 deaths.

covidtracking.com/data/long-term… Image
Last week, South Carolina released federal vaccine data that shows which long-term-care facilities have received doses. They are the only state providing this transparency on the vaccine process.

The CDC and other states should follow their lead.

scdhec.gov/covid19/covid-… Image
Read 4 tweets
13 Jan
Our daily update is published. States reported 1.9M tests, 214k cases, 131,326 people currently hospitalized with COVID-19, and 4,056 deaths. 4 bar charts showing key COVID-19 metrics for the US over ti
The 7-day average number of deaths reported is again a record, continuing to climb after a reporting dip following the holidays. Chart showing the daily reported deaths and the 7-day averag
These deaths are occurring in all regions of the country, with the sharpest increases currently in the South and West. Chart showing the reported deaths and 7-day averages for the
Read 4 tweets
12 Jan
Our daily update is published. States reported 1.9M tests, 194k cases, 129,748 people currently hospitalized with COVID-19, and 1,739 deaths. Four charts showing the nationwide COVID-19 daily tests, dai
Hospitalizations in CA continue to skyrocket. There are 22,633 people currently hospitalized with COVID-19 in the state. A map of the united states showing currently hospitalized du
Per capita cases in the West are quickly approaching the Midwest peak during fall 2020. Chart showing the 7-day average for new cases reported for e
Read 4 tweets
9 Jan
Our daily update is published. States reported 2.1M tests, a record 310k cases, 131,889 COVID-19 hospitalizations, and 3,777 deaths. The 7-day averages for cases, hospitalizations, and deaths are at record highs. 4 bar charts showing key COVID-19 metrics for the US over ti
NJ reported nearly 20K probable COVID-19 cases and CA reported over 50K cases. Both states greatly influenced the large uptick in today's total cases.
16 states reported their highest number of COVID-19 hospitalizations this week. Chart showing the week during which each state reported the
Read 6 tweets
8 Jan
Our daily update is published. States reported 1.9M tests, 266k cases, 132,370 COVID-19 hospitalizations, and a record 4,033 deaths. The 7-day average for deaths is now over 2,750, also a record. Four charts, showing the na...
California, Florida, and Texas alone reported 80 thousand cases today. 3 charts showing cases in C...
But some small states have severe problems, too. Alabama, Arizona, and Nevada have very high hospitalization rates per capita. Hex map showing the number ...
Read 4 tweets

Did Thread Reader help you today?

Support us! We are indie developers!


This site is made by just two indie developers on a laptop doing marketing, support and development! Read more about the story.

Become a Premium Member ($3/month or $30/year) and get exclusive features!

Become Premium

Too expensive? Make a small donation by buying us coffee ($5) or help with server cost ($10)

Donate via Paypal Become our Patreon

Thank you for your support!

Follow Us on Twitter!