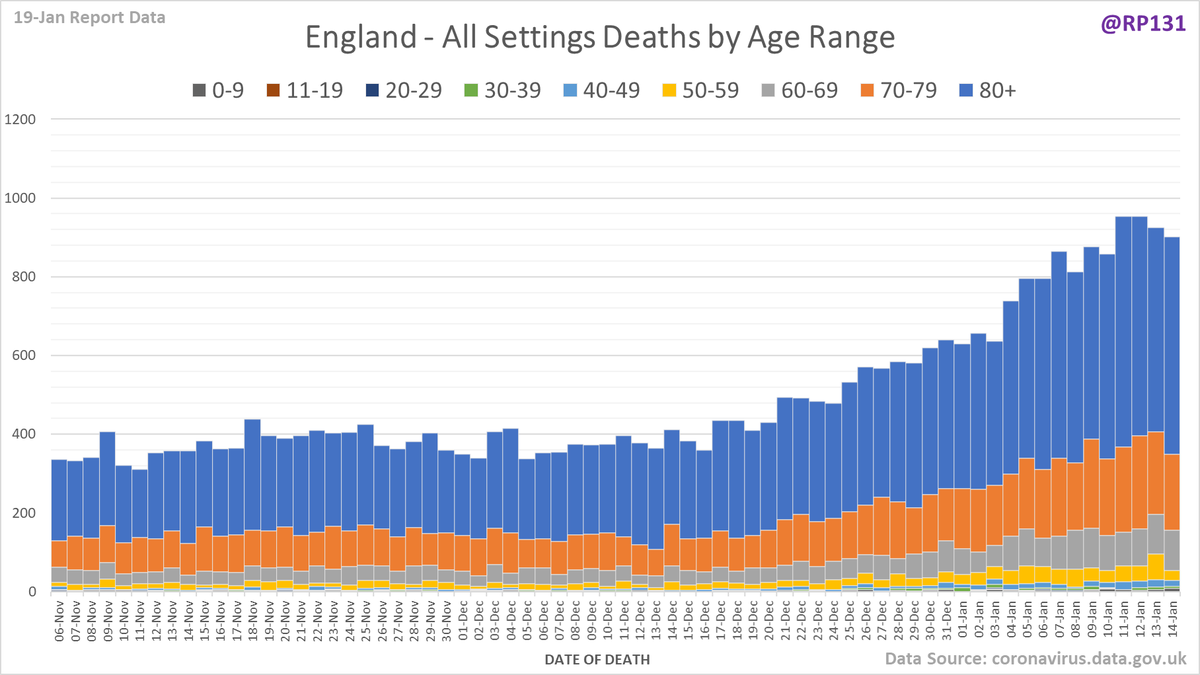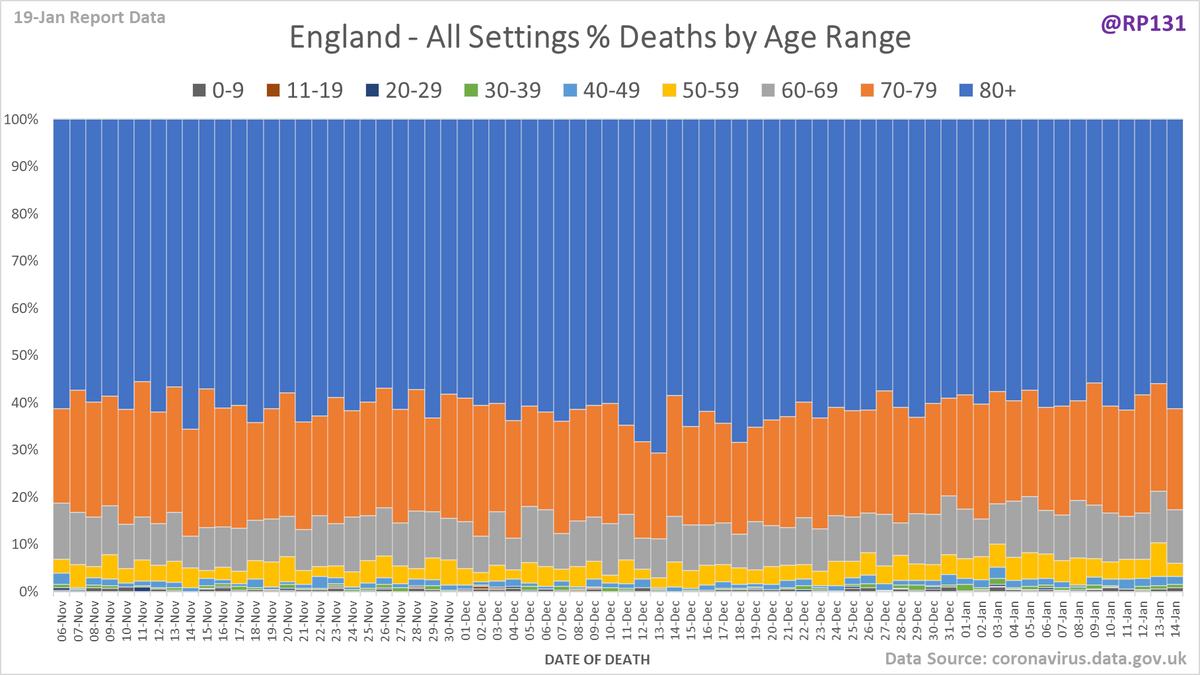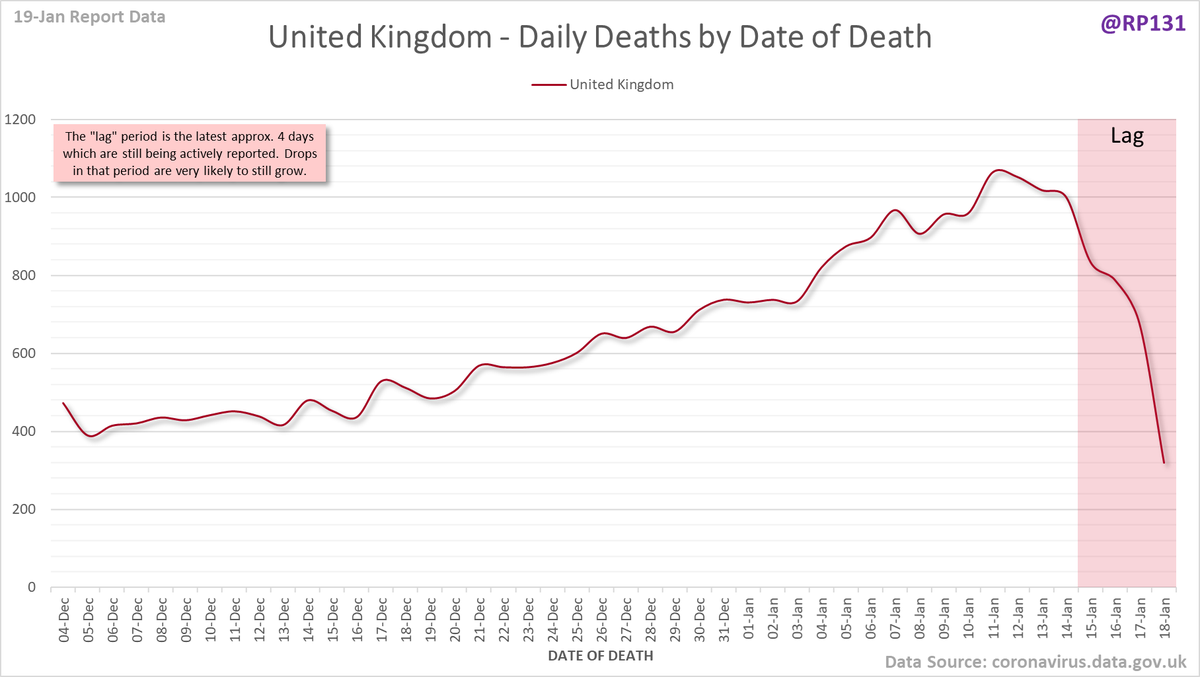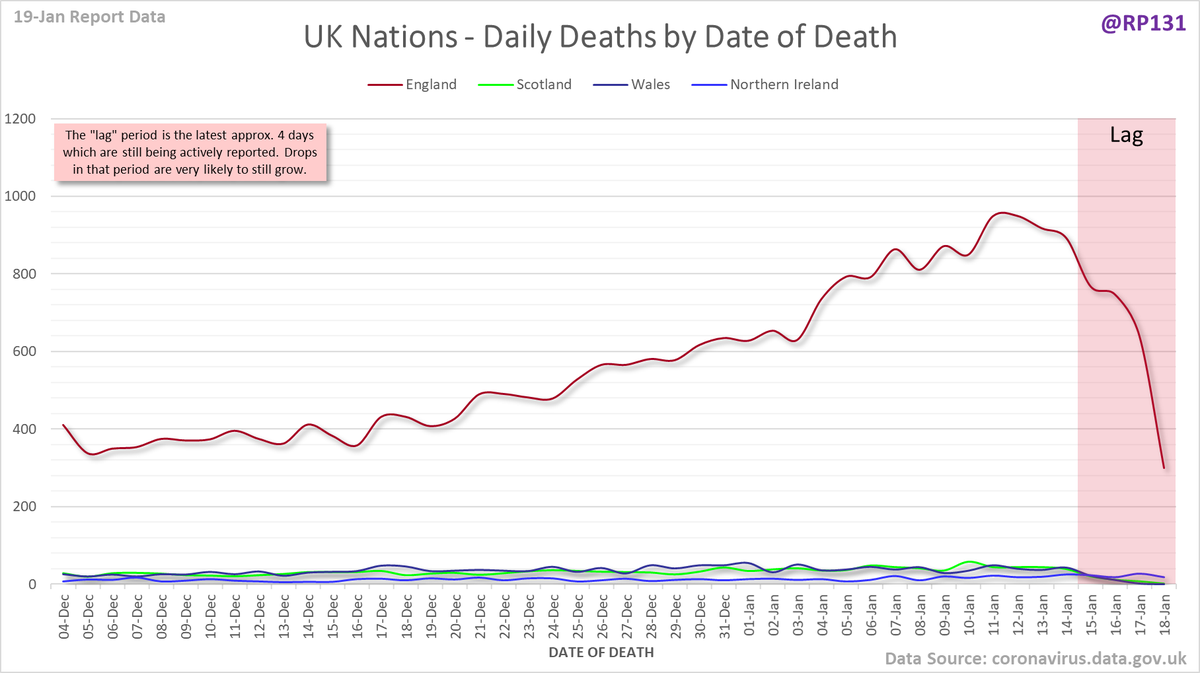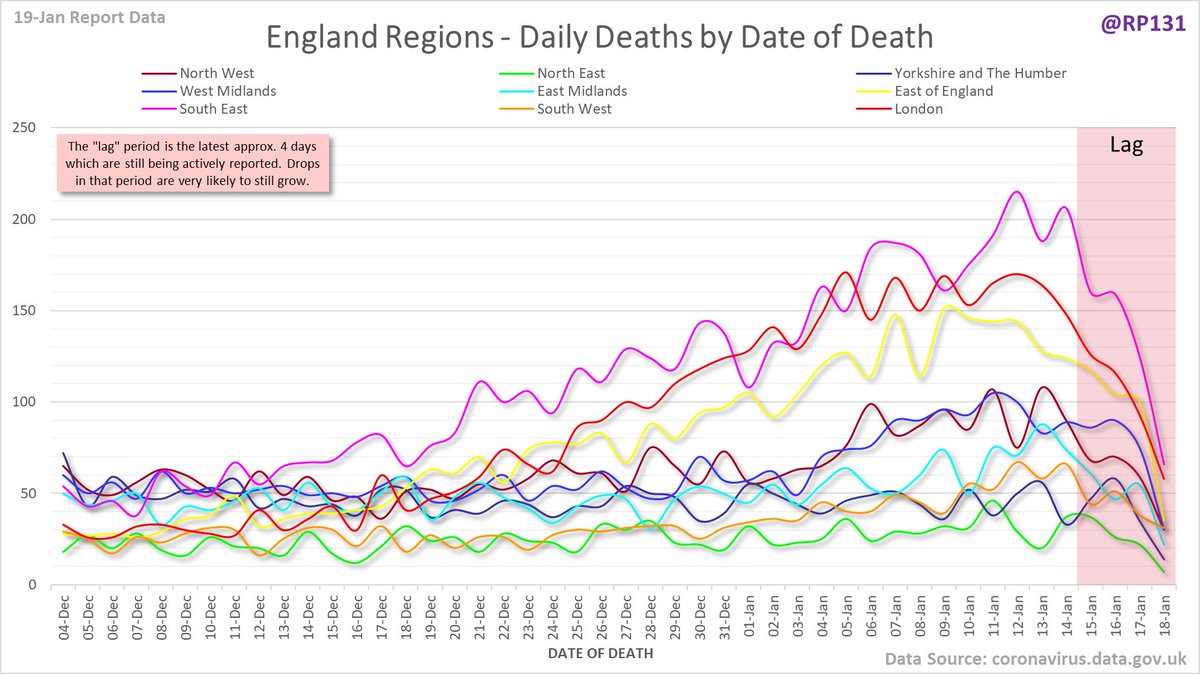
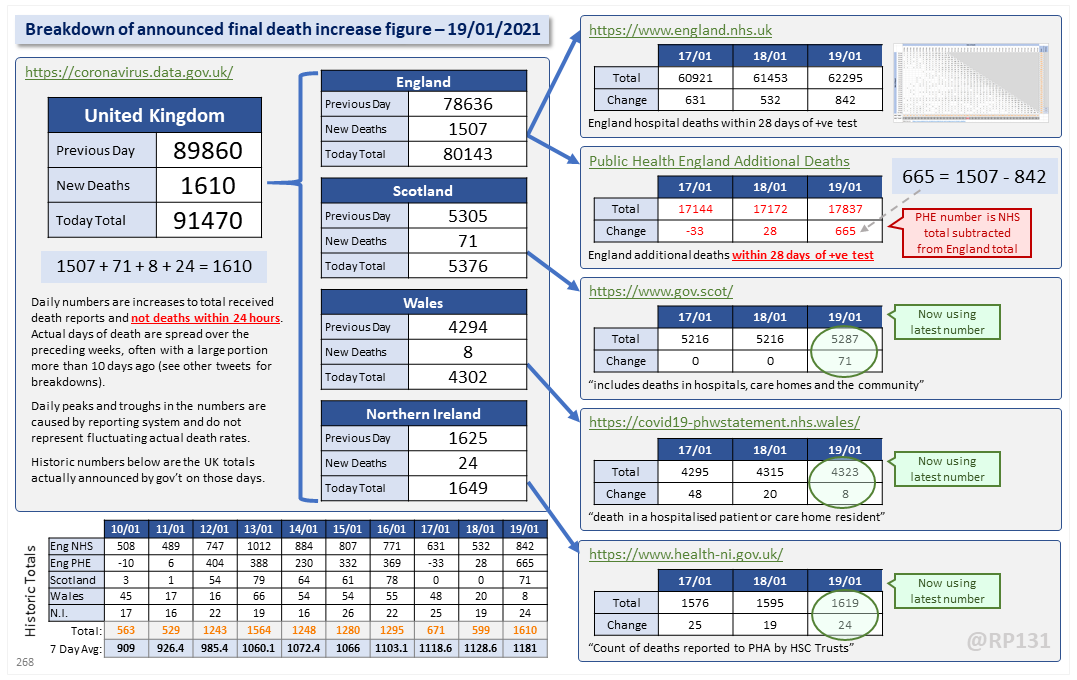
Dashboard for 19-Jan to explain where the #covid19uk total death increase figure of 1610 actually comes from. The PHE dataset merge resulted in a net of 665 additional deaths today. This moves the 7 day rolling average up by 52.4 to 1181. 
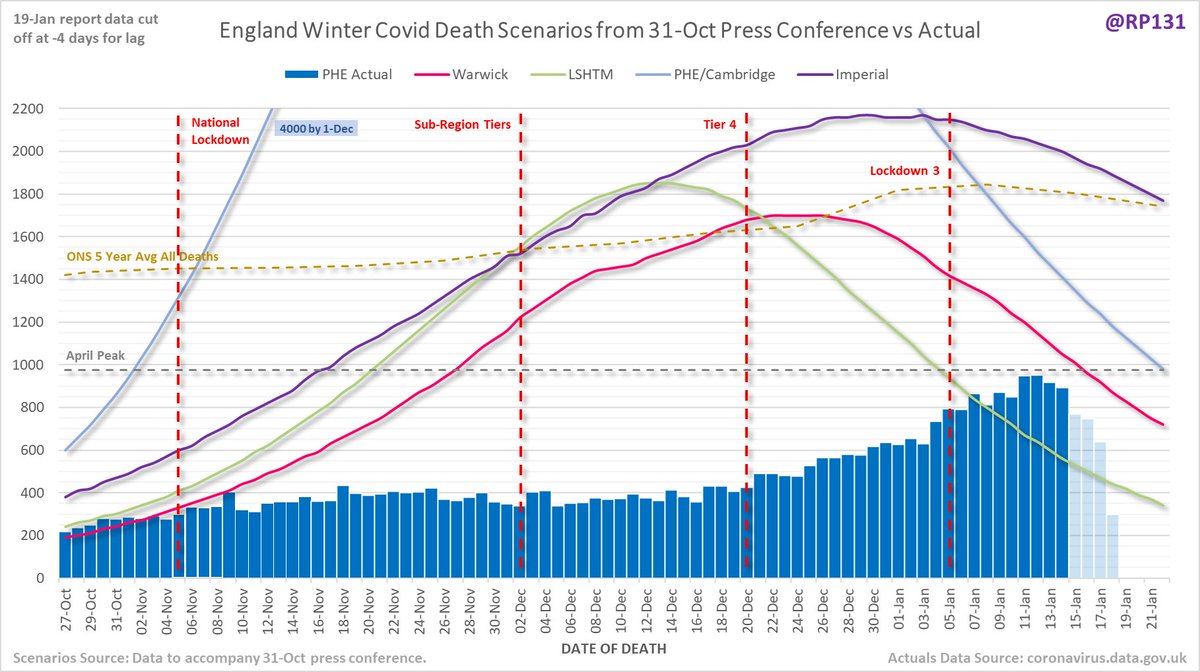
Updated chart from 31-Oct lockdown press conference with latest England date-of-death data (latest 4 days faded out for lag): 
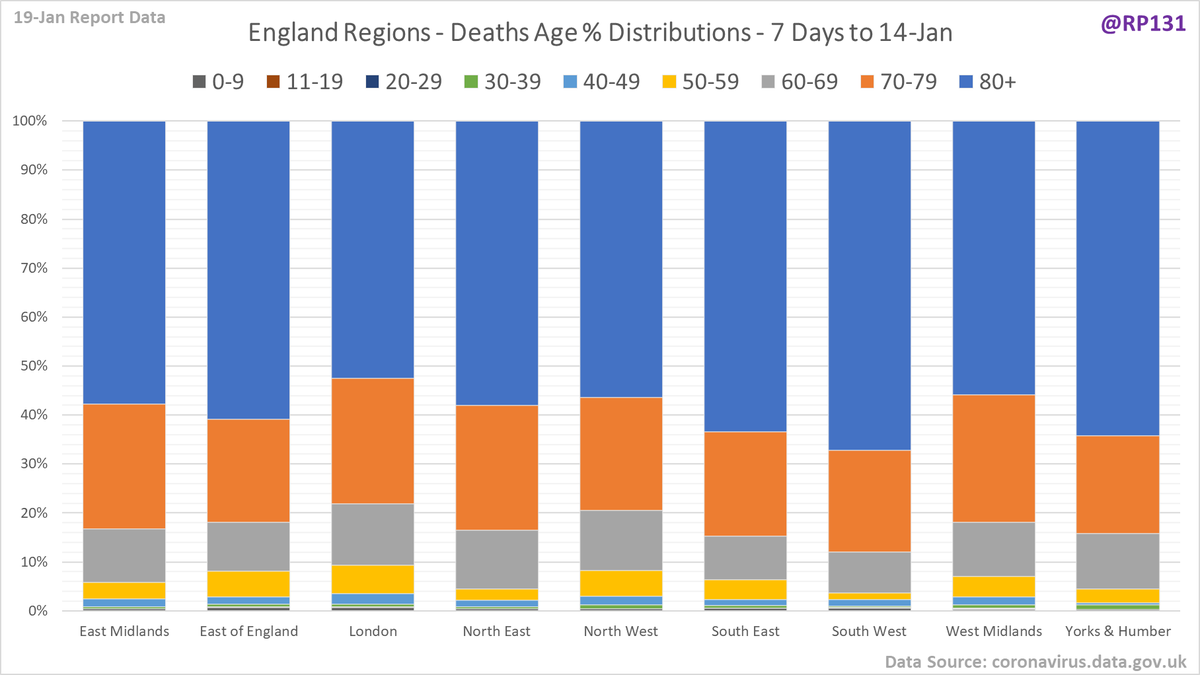
England regional age percentage distribution chart for latest 7 days data to see if there is any variation between regions. 
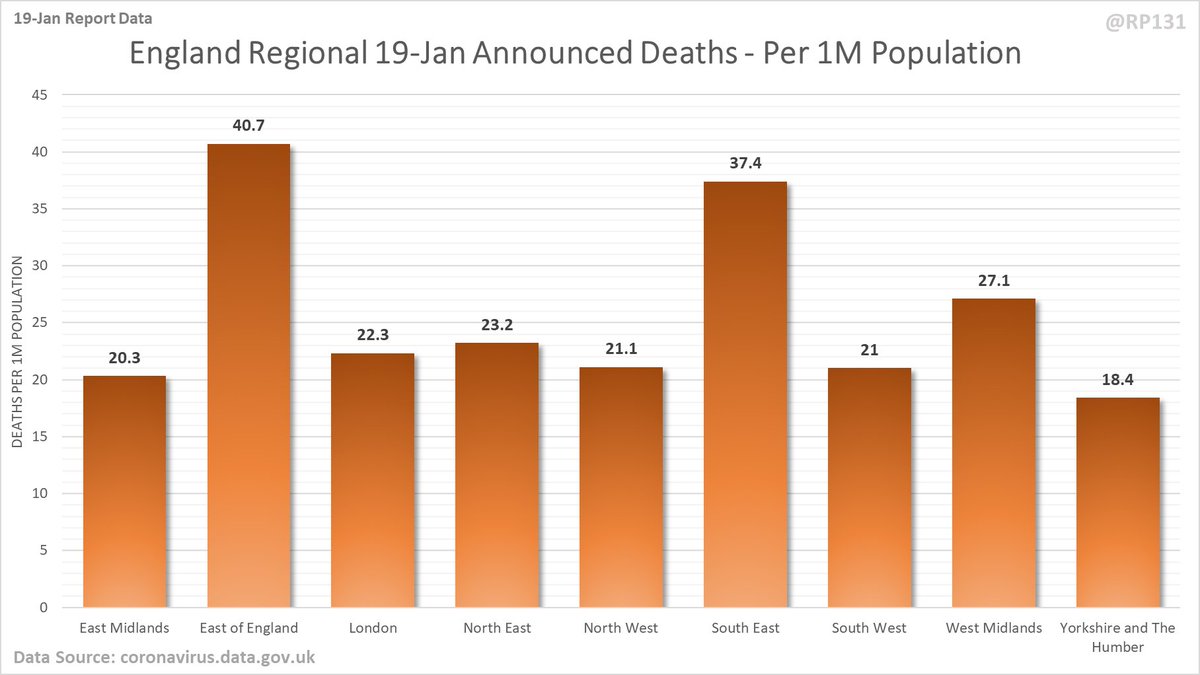
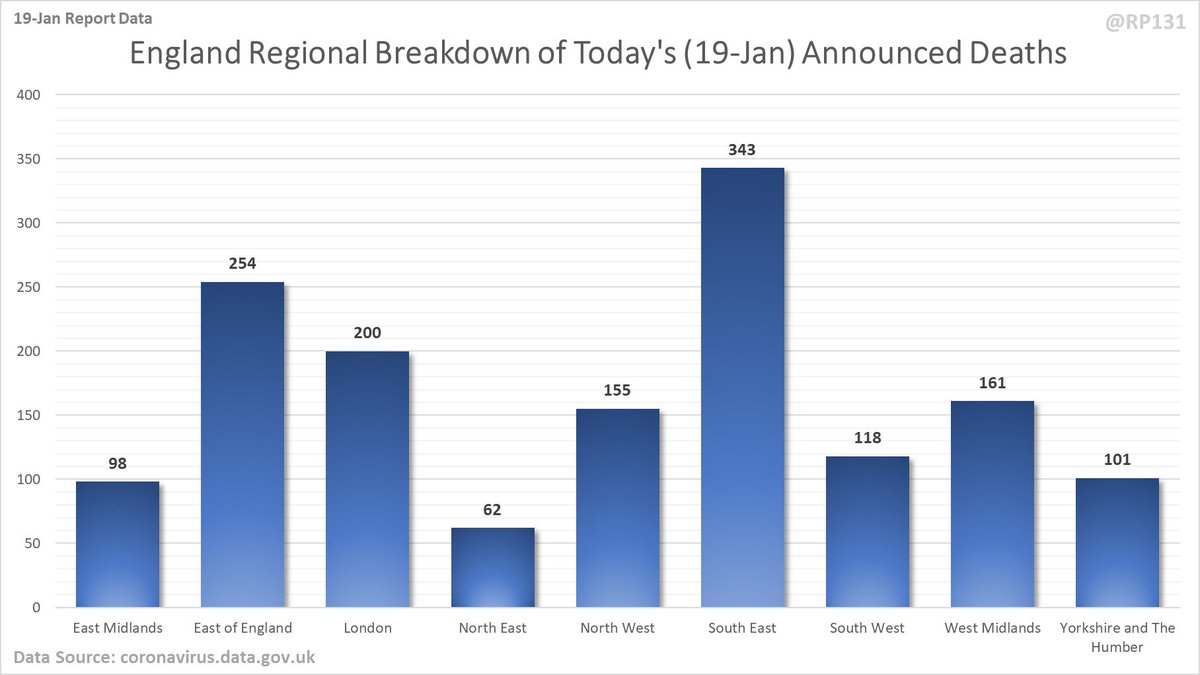
Breakdown of today's newly reported England deaths by region. Note that this data (1492) doesn't always quite add up to the total England number they announce (1507) possibly due to data merging issues. However I still think it's useful to see the general distribution. 
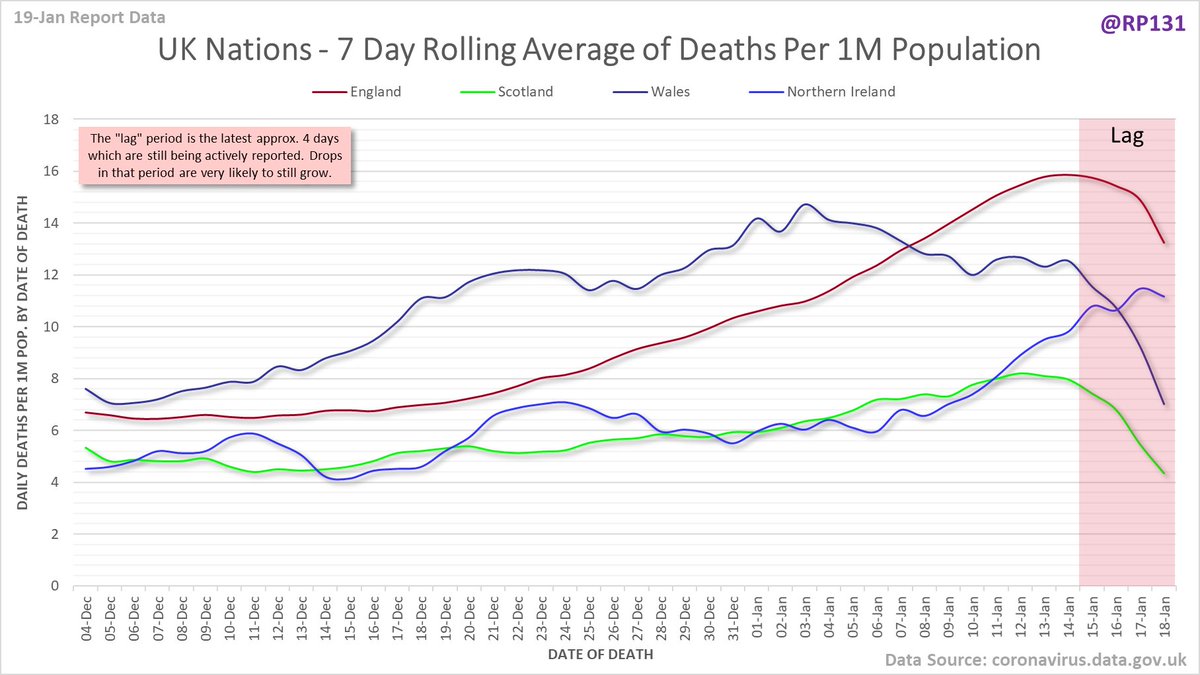
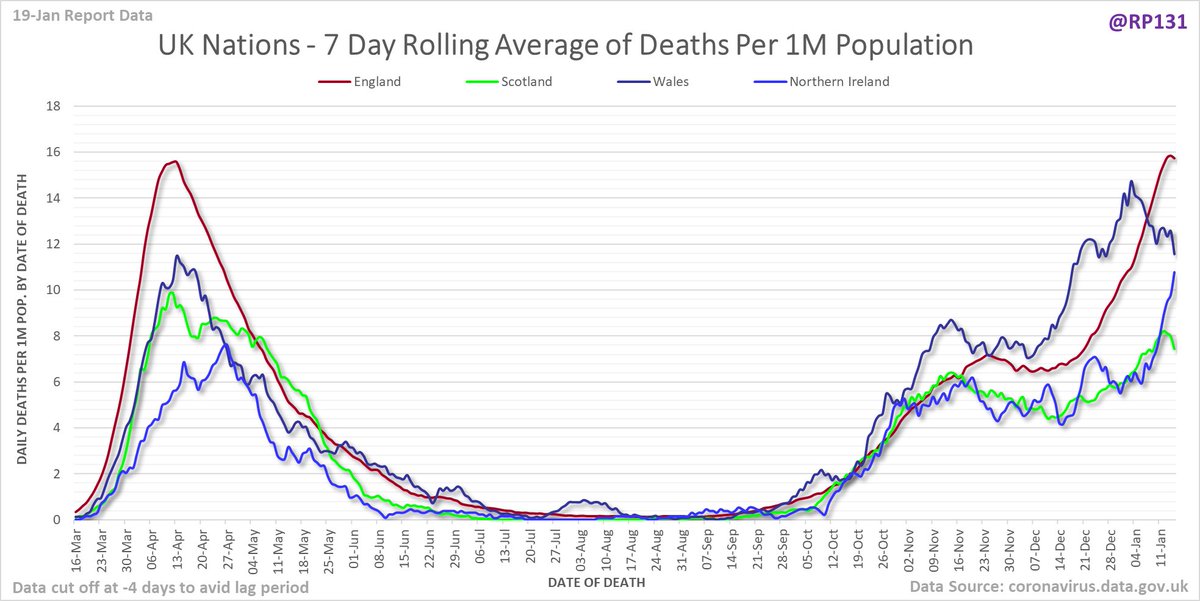
Full version since March of date of death chart for UK nations drawn with 7 day rolling averages of deaths per 1M population. 
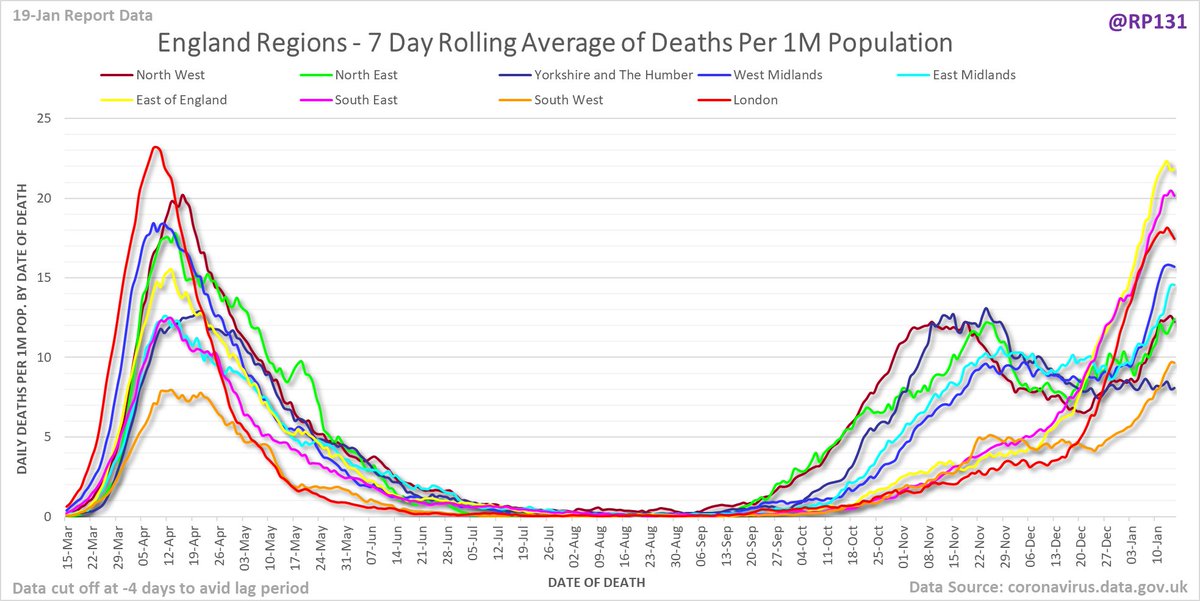
Date of death chart for England regions drawn with 7 day rolling averages of deaths per 1M population." 
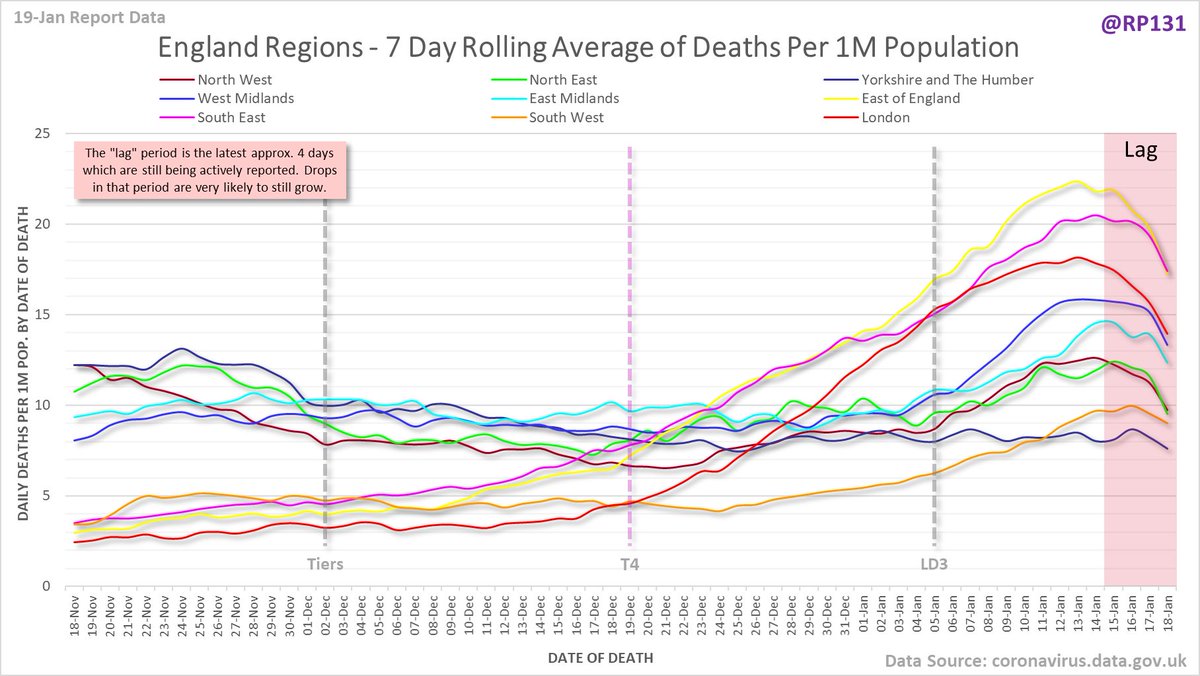
Full version since March of date of death chart for England regions drawn with 7 day rolling averages of deaths per 1M population. 
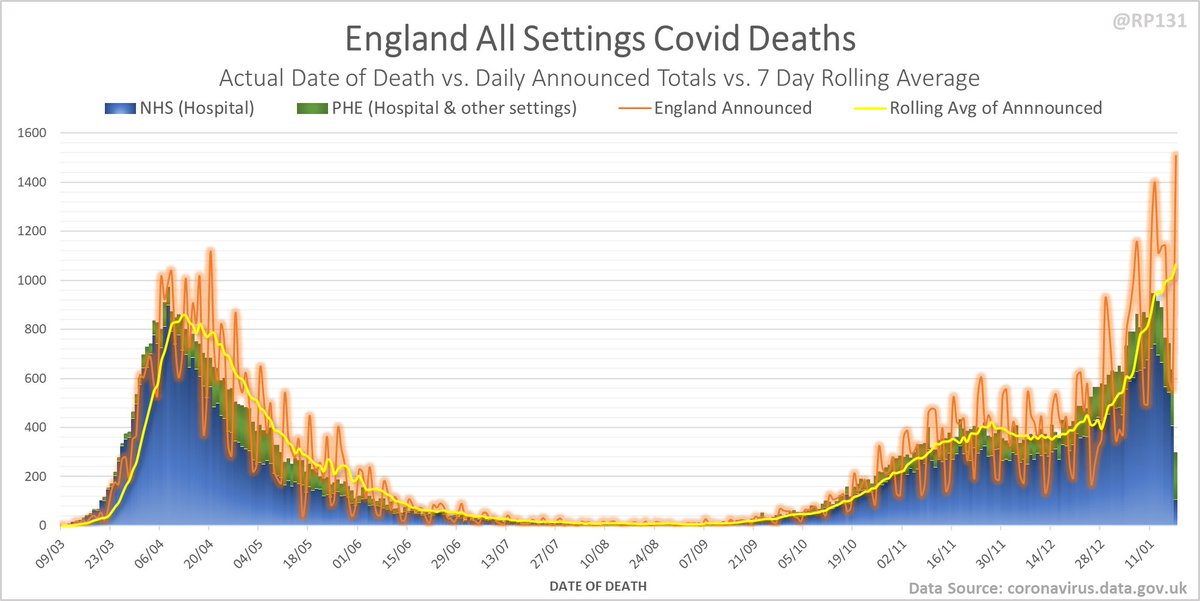
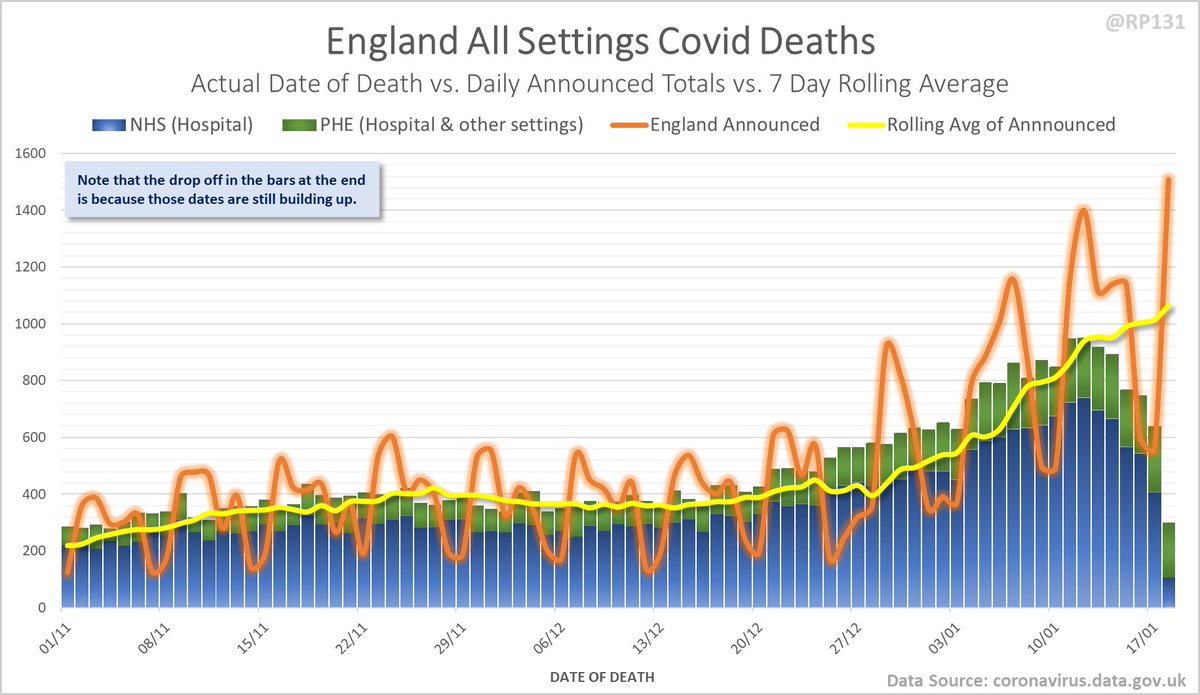
England date-of-death vs. announcement chart. Note that the numbers drop at the end as data is still being actively reported for those dates. 
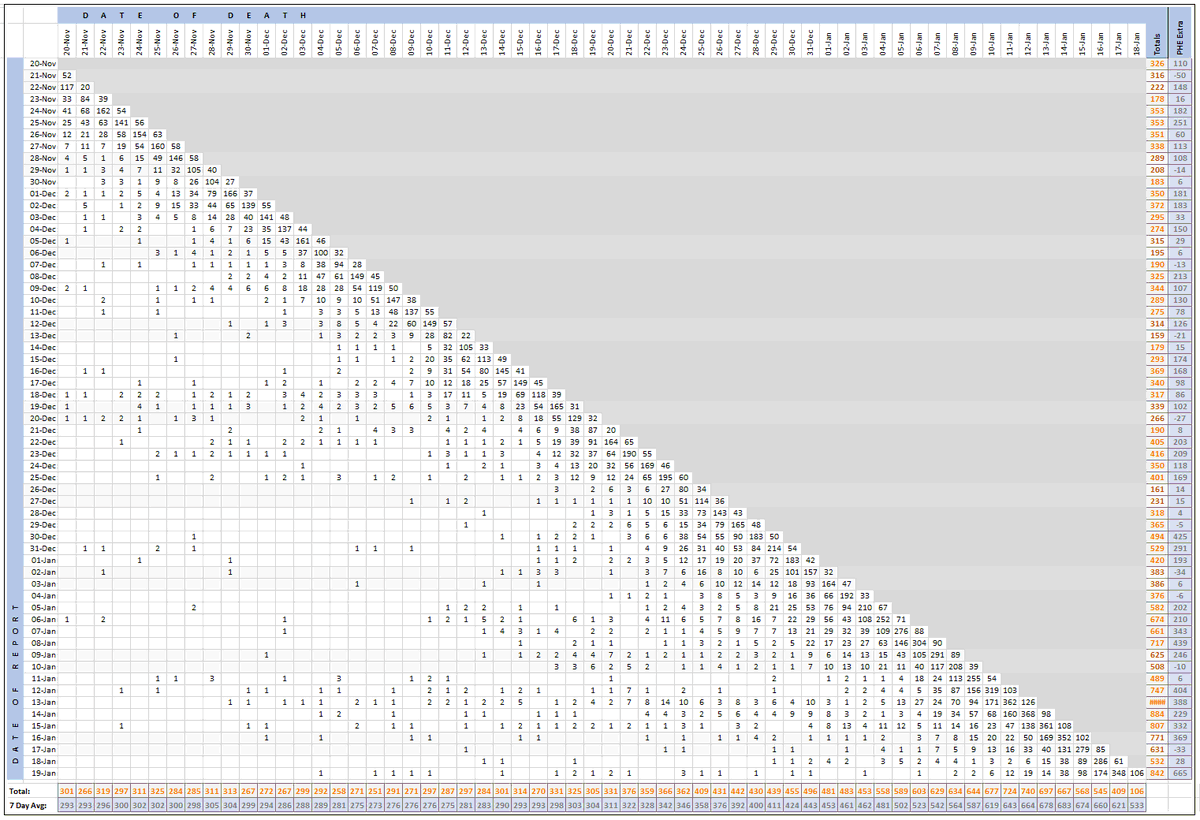
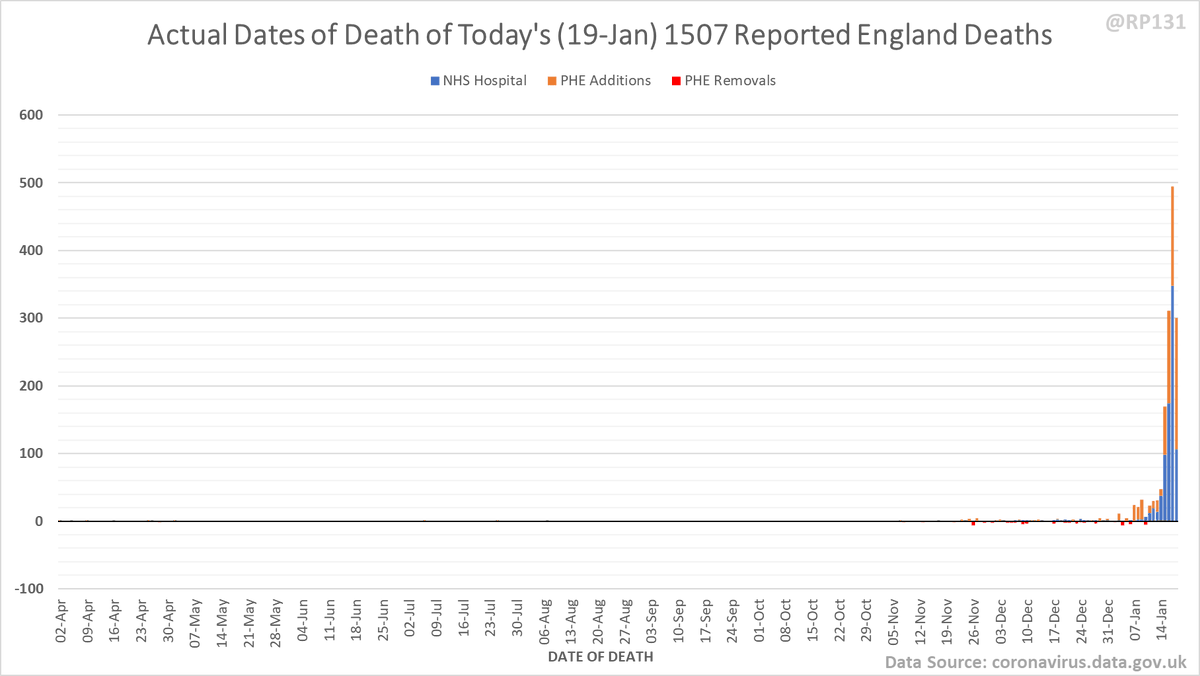
Pivot for 19-Jan to show breakdown of both 842 NHS and 665 (net) PHE deaths by date of death. The negatives are a combination of date of death corrections and accounting for NHS deaths that were already known to PHE. Small version for twitter first: 
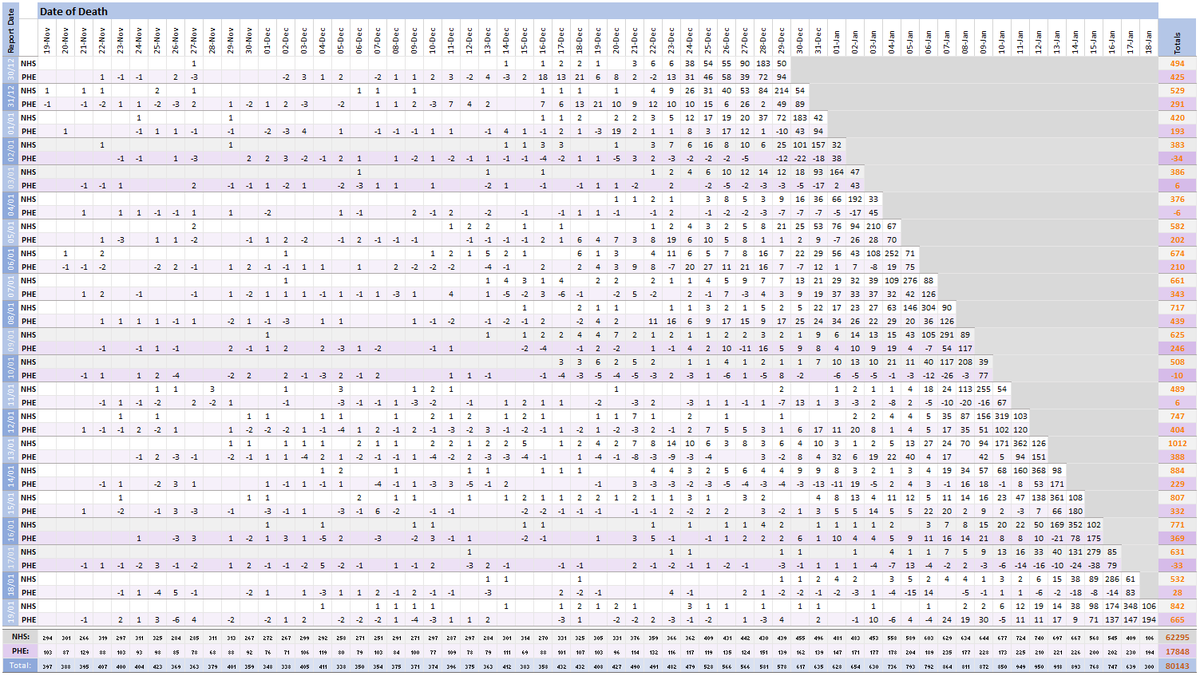
Full version available here: …ddatashare.s3-eu-west-1.amazonaws.com/Pivot_PHE_2021…
Chart form of dates of since 01-Dec (ignoring some of the corrections noise from earlier in the year): 
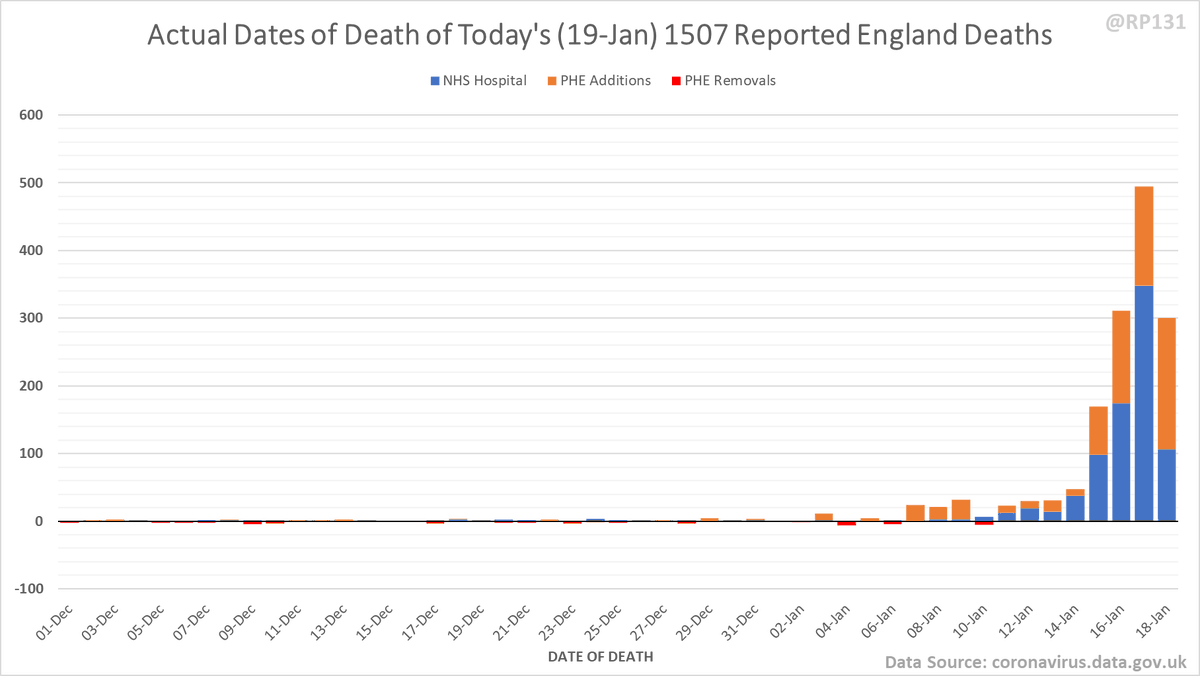
Full date of death chart (most of the noise earlier in the year is likely due to dataset merge errors and/or corrections). 
• • •
Missing some Tweet in this thread? You can try to
force a refresh
