1/n
I am working on a paper on why interest rates and yields are as low as they are. I will share some preliminary results here.
I am working on a paper on why interest rates and yields are as low as they are. I will share some preliminary results here.
2/n
What I will share are some of the output from a simple model for US 10-year Treasury bond yields.
What I will share are some of the output from a simple model for US 10-year Treasury bond yields.
3/n
It is key to me that the model not only is statistically significantly, but is also economically significant. We need to understand economic developments within economic theory.
It is key to me that the model not only is statistically significantly, but is also economically significant. We need to understand economic developments within economic theory.
4/n
I have estimated a model for the US 10-year bond yield based on the following fundamental variables.
I have estimated a model for the US 10-year bond yield based on the following fundamental variables.
5/n
1) Nominal GDP growth (per capita).
1) Nominal GDP growth (per capita).
6/n
This of course captures the standard textbook relationship from growth theory (the Solow model) in which there is a positive relationship between real interest rates and real GDP as well as the Fischer equation where nominal interest rates are positive related to inflation.
This of course captures the standard textbook relationship from growth theory (the Solow model) in which there is a positive relationship between real interest rates and real GDP as well as the Fischer equation where nominal interest rates are positive related to inflation.
7/n
2. Population growth
2. Population growth
8/n
Population growth (and demographics in general) should be expected to impact yields through numerous channels.
Population growth (and demographics in general) should be expected to impact yields through numerous channels.
9/n
I would particularly highlight the impact on growth, risk appetite and savings. Overall we should expect higher population growth to increase yields.
I would particularly highlight the impact on growth, risk appetite and savings. Overall we should expect higher population growth to increase yields.
10/n
3. Inflation variance
3. Inflation variance
11/n
This reflects the compensation investors would demand for lack of credibility of monetary policy.
This reflects the compensation investors would demand for lack of credibility of monetary policy.
12/n
Finally, 4. Employment-population ratio.
Finally, 4. Employment-population ratio.
13/n
This is measure of the slack in the US economy and should overall capture the US business cycle.
This is measure of the slack in the US economy and should overall capture the US business cycle.
14/n
Futuremore, I have been playing around with different meausre of debt and leverage in the US economy - both private and public debt. None of these variables however, seem to have a statistically significant impact on US yields and rates.
Futuremore, I have been playing around with different meausre of debt and leverage in the US economy - both private and public debt. None of these variables however, seem to have a statistically significant impact on US yields and rates.
15/n
The reason for this might be that these factors are correlated with growth, inflation and demographics.
The reason for this might be that these factors are correlated with growth, inflation and demographics.
16/n
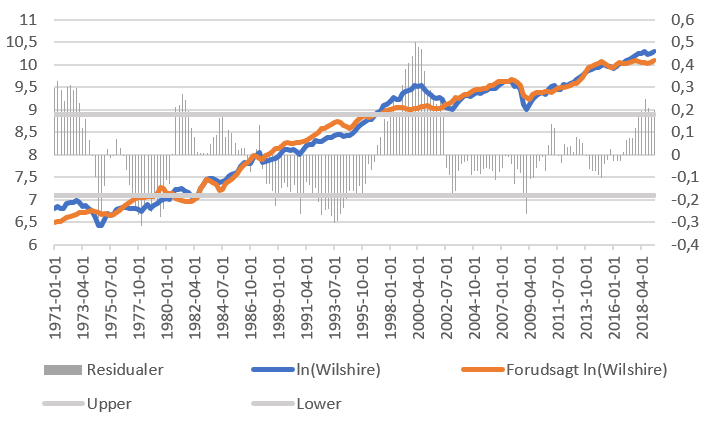
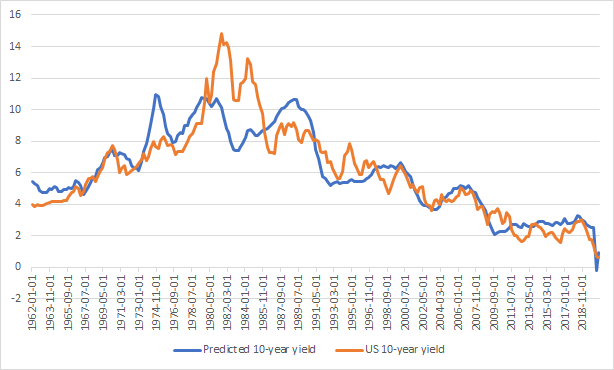
The graph below shows 10-years US yields and the predicted model.
We see the model has quite a good fit over the past nearly 60 years.
The graph below shows 10-years US yields and the predicted model.
We see the model has quite a good fit over the past nearly 60 years.
17/n
We also see that there are some well-known different periods - for example the Great Inflation of the 1970s when yields reached historically high levels and the present period where yields are very low.
We also see that there are some well-known different periods - for example the Great Inflation of the 1970s when yields reached historically high levels and the present period where yields are very low.
18/n
We can use the model to decompose the development in yields during different periods.
We can use the model to decompose the development in yields during different periods.
19/n
I have looked at the following four periods:
The Great Inflation (1967-82)
Disinflation (1982-1992)
The Great Moderation (1992-2008)
The Great Stagnation (2008-today)
I have looked at the following four periods:
The Great Inflation (1967-82)
Disinflation (1982-1992)
The Great Moderation (1992-2008)
The Great Stagnation (2008-today)
20/n
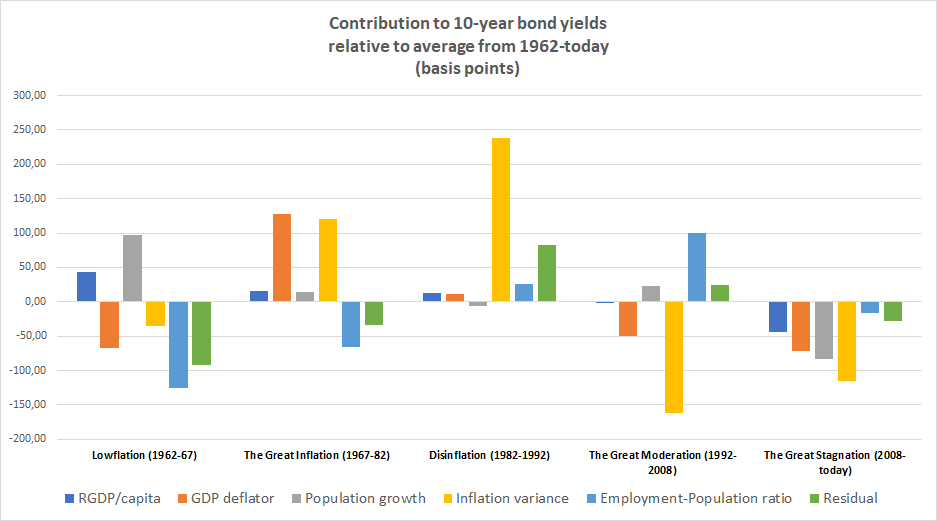
The table below shows the decomposition of the contribution (basis points) to yields from the different factors in the models (note we split NGDP between RGDP growth and inflation).
The table below shows the decomposition of the contribution (basis points) to yields from the different factors in the models (note we split NGDP between RGDP growth and inflation).

21/n
The decomposition is done RELATIVE to the average impact on yields during the period from 1962 and until today.
The decomposition is done RELATIVE to the average impact on yields during the period from 1962 and until today.
22/n
Lets go through each separate period.
Lets go through each separate period.
23/n
Lowflation (1962-67)
During this period yields and rate where low relative to the historical average for the whole estimation period.
Lowflation (1962-67)
During this period yields and rate where low relative to the historical average for the whole estimation period.
24/n
We that during the Lowflation period inflation was as was inflation variance. Hence, we had a period of nominal stability as well as some slack in the US economy with higher population growth than employment growth.
...
We that during the Lowflation period inflation was as was inflation variance. Hence, we had a period of nominal stability as well as some slack in the US economy with higher population growth than employment growth.
...

25/n
Higher RGDP/cap growth and pop. growth on the other hand were contributing to higher yields during the lowflation period but the other factors where stronger resulting in overall low yields in this period.
Higher RGDP/cap growth and pop. growth on the other hand were contributing to higher yields during the lowflation period but the other factors where stronger resulting in overall low yields in this period.
26/n
The Great Inflation started around 1967 and ended around 1982.
During this period US-yields and rates rose to historically high levels and the main driver was significant monetary instability with rising and volatile US inflation.
The Great Inflation started around 1967 and ended around 1982.
During this period US-yields and rates rose to historically high levels and the main driver was significant monetary instability with rising and volatile US inflation.

27/n
It is notable that during this period not only higher inflation pushed up yields, but equally inflation variance contributed to a similar degree to higher yields. We here see that the lose of monetary policy credibility is very costly.
It is notable that during this period not only higher inflation pushed up yields, but equally inflation variance contributed to a similar degree to higher yields. We here see that the lose of monetary policy credibility is very costly.
28/n
In 1979 Paul Volcker became Federal Reserve chairman and the following year initiated an effort to reestablish monetary policy credibility and to push down inflation.
In 1979 Paul Volcker became Federal Reserve chairman and the following year initiated an effort to reestablish monetary policy credibility and to push down inflation.
29/n
However, we here date the disinflation period from 1982 and until 1992.
The Fed's efforts paid off and inflation dropped markedly during this period relative to the Great Inflation period.
However, we here date the disinflation period from 1982 and until 1992.
The Fed's efforts paid off and inflation dropped markedly during this period relative to the Great Inflation period.

30/n
However, it is notable that bond yields did not immediately drop to reflect 1-to-1 and inflation variance - measured as 10-year moving variance in quarter/quarter changes in the GDP deflation remained high.
However, it is notable that bond yields did not immediately drop to reflect 1-to-1 and inflation variance - measured as 10-year moving variance in quarter/quarter changes in the GDP deflation remained high.
31/n
One can of course discuss this measure, but it seems to pretty well capture the fact that it took time to gain credibility about the Fed's renewed commitment to low inflation .
One can of course discuss this measure, but it seems to pretty well capture the fact that it took time to gain credibility about the Fed's renewed commitment to low inflation .
32/n
Hence, we see that this lack of credibility measured as inflation variance kept 10-year yields nearly 250bp higher than it would have been if the Fed had had the kind of credibility it had during the 1960s or after 1992.
Hence, we see that this lack of credibility measured as inflation variance kept 10-year yields nearly 250bp higher than it would have been if the Fed had had the kind of credibility it had during the 1960s or after 1992.

33/n
By 1992 the Fed had reestablished nominal stability and credibility regaining its commitment to low and stable inflation. This was the start of the Great Moderation period (1992-2008)
By 1992 the Fed had reestablished nominal stability and credibility regaining its commitment to low and stable inflation. This was the start of the Great Moderation period (1992-2008)
34/n
The Great Moderation period was very much a goldilocks period - with high growth due to both strong productivity growth (RGDP/cap) and strong population growth AND at the same time low and stable inflation.
The Great Moderation period was very much a goldilocks period - with high growth due to both strong productivity growth (RGDP/cap) and strong population growth AND at the same time low and stable inflation.

34/n
It is notable that during this period yields continued to trend down despite strong growth in the economy - mainly as a result of low and declining inflation and lower inflation variance.
It is notable that during this period yields continued to trend down despite strong growth in the economy - mainly as a result of low and declining inflation and lower inflation variance.
35/n
However, an often overlooked factor during this period is that the US economy was in a 'high pressure' state with a quite high level of employment relative to the population. This added around 100bp to 10-year yields during the Great Moderation years.
However, an often overlooked factor during this period is that the US economy was in a 'high pressure' state with a quite high level of employment relative to the population. This added around 100bp to 10-year yields during the Great Moderation years.

36/n
This 'high pressure' period abruptly came to and end in 2008 when the Great Recession hit.
This 'high pressure' period abruptly came to and end in 2008 when the Great Recession hit.
37/n
The period following 2008 has also been called the Great Stagnation which from the perspective of bond yields seems more appropriate that then Great Recession.
The period following 2008 has also been called the Great Stagnation which from the perspective of bond yields seems more appropriate that then Great Recession.
38/n
Hence, what we see is that yields have not be low from 2008 primarily because of a recession.
In fact the 'business cycle' factor (Employment-Population ratio) is the least important reason for yields being low after 2008.
Hence, what we see is that yields have not be low from 2008 primarily because of a recession.
In fact the 'business cycle' factor (Employment-Population ratio) is the least important reason for yields being low after 2008.

39/n
Rather what is telling about yields after 2008 is that ALL factors are dragging down yields - RGDP, pop. growth. inflation, inflation variance and Em-pop.-ratio are all lower than their historical averages.
Rather what is telling about yields after 2008 is that ALL factors are dragging down yields - RGDP, pop. growth. inflation, inflation variance and Em-pop.-ratio are all lower than their historical averages.

40/n
Maybe most notable compared to the Great Moderation years is population growth now is a major drag on bond yields.
But again - it is more the fact that ALL factors are pushing down yields rather than one specific factor.
Maybe most notable compared to the Great Moderation years is population growth now is a major drag on bond yields.
But again - it is more the fact that ALL factors are pushing down yields rather than one specific factor.

41/n
The model does not explain everything which we see from the model's residuals - the green bars in the graph.
But it is notable that the model actually is better during the Great Stagnation period than at any other period (small residuals).
The model does not explain everything which we see from the model's residuals - the green bars in the graph.
But it is notable that the model actually is better during the Great Stagnation period than at any other period (small residuals).

42/n
This furthermore underscores what I personally has been arguing since 2008 - yields and rates are not low because monetary policy is 'easy'. Rather low rates and yields reflect fundamentals - low productivity growth, low pop. growth and (too) low and stable inflation.
This furthermore underscores what I personally has been arguing since 2008 - yields and rates are not low because monetary policy is 'easy'. Rather low rates and yields reflect fundamentals - low productivity growth, low pop. growth and (too) low and stable inflation.
43/n
Furthermore, even though there has been some slack in the US economy it is not slack that is the main reason for low yields either - even though we have not been in the same kind of 'high pressure' economy as during the Great Moderation.
Furthermore, even though there has been some slack in the US economy it is not slack that is the main reason for low yields either - even though we have not been in the same kind of 'high pressure' economy as during the Great Moderation.
44/n
Presently US yields are very, very low and the question is of course where we will be going from here.
We can use our yield model to try to give a predictions for bond yields in the medium-term.
Presently US yields are very, very low and the question is of course where we will be going from here.
We can use our yield model to try to give a predictions for bond yields in the medium-term.
45/n
If we use reasonable estimate for RGDP/cap growth (1%), inflation (2%), pop. growth (0.5%) and a return of employment-population ratio to the levels of 2018-18 then the model predict a 10-year US bond yield of 2.5-3.0%.
If we use reasonable estimate for RGDP/cap growth (1%), inflation (2%), pop. growth (0.5%) and a return of employment-population ratio to the levels of 2018-18 then the model predict a 10-year US bond yield of 2.5-3.0%.
46/n
In a historical perspective this is still very low yields, but significantly above present level (150-200bps).
The key driver in the model would be a return to a pre-2020 level of employment-population ratio around 60.
In a historical perspective this is still very low yields, but significantly above present level (150-200bps).
The key driver in the model would be a return to a pre-2020 level of employment-population ratio around 60.

47/n
I have earlier argued that we are likely to see very strong growth during 2021 and I certainly do not find it unlikely that we could see a return to 2019 level for the employment-population ratio already during 2021.
I have earlier argued that we are likely to see very strong growth during 2021 and I certainly do not find it unlikely that we could see a return to 2019 level for the employment-population ratio already during 2021.
48/n
This in turn could cause a steep rise in bond yields - maybe as much as 150-200bps. If that where to happen it would be the sharpest rise in bond yields in 2000 years, but I certainly don't think that should be ruled out.
This in turn could cause a steep rise in bond yields - maybe as much as 150-200bps. If that where to happen it would be the sharpest rise in bond yields in 2000 years, but I certainly don't think that should be ruled out.
49/n
The purpose of my research in this area is to understand why yields have declined to present low levels. My key takeaway is that there is nothing 'special' about the present levels of yields and we can easily understand within standard economic theory.
The purpose of my research in this area is to understand why yields have declined to present low levels. My key takeaway is that there is nothing 'special' about the present levels of yields and we can easily understand within standard economic theory.
50/50
The model that can explain rising and yields in the 1970s can fully explain why yields are low today. It's all about fundamentals and we really shouldn't be surprised by the low level of yields.
/The end.
The model that can explain rising and yields in the 1970s can fully explain why yields are low today. It's all about fundamentals and we really shouldn't be surprised by the low level of yields.
/The end.
• • •
Missing some Tweet in this thread? You can try to
force a refresh