
Taking a short break from modelling ‘vax & relax’ strategies, I have updated my model of infections at local level (MSOA) in England, looking for any evidence of impact on infection rates in Wave 3 (Dec & Jan) from accumulated immunity across Waves 1 & 2 (Mar-Nov) THREAD 1/n
TL;DR: there’s a similar pattern to before, with some evidence of high (>15%) attack rates in Waves 1 & 2 leading to slightly more muted attack rates in Wave 3. But there still isn’t any sign of local areas approaching ‘herd immunity’ levels. 2/n
As before, the data is simply aggregated weekly cases per MSOA across England, taken from the gov.uk dashboard. Big thanks to @ArtySmokesPS for lending me his multipliers for case ascertainment, which enable me to estimate actual infections in each area 3/n
I have then bucketed the MSOAs by their total infection rate across Mar-Nov, rounded to the nearest 5%, and looked at the infection rate in Wave 3 (Dec/Jan) for each bucket. This produces the following graph: 4/n 
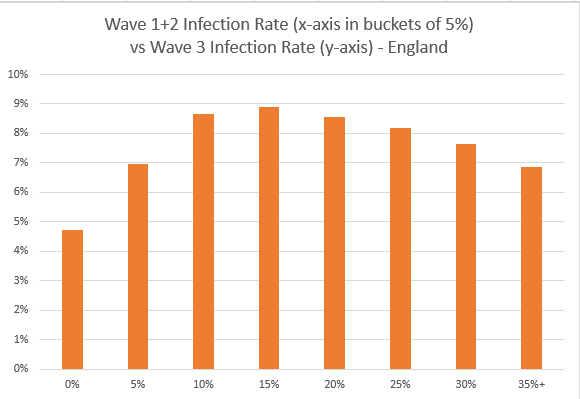
As you can see there’s a positive correlation between attack rates for (w1+w2) and w3 when the (w1+w2) attack rate is low (up to 15%), but a negative correlation at higher attack rates (>15%). It’s plausible that immunity could be driving that negative correlation 5/n
But it’s very hard to unpick the exact effect from the data, because we don’t have a clean counterfactual i.e. what would it look like without immunity? 6/n
With thanks to @video4me for the suggestion, I’ve plotted another graph that shows an adjusted attack rate for wave3, with those infected in wave1 and wave2 removed from the denominator i.e. we’re looking at the % of remaining susceptible people who are infected 7/n
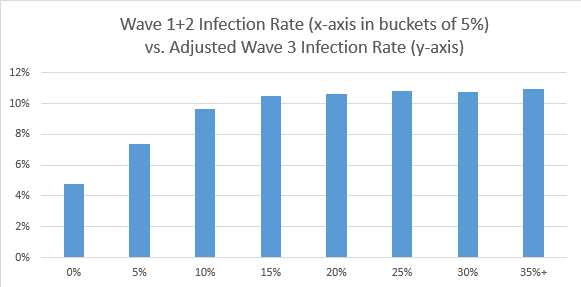
As you can see, the adjusted attack rate in w3 remains flat for high (w1+w2) attack rates – suggesting that there’s not much sign of ‘herd immunity’ effects starting to appear, where the level of immunity would protect the remaining susceptibles from infection 8/n
I also spent a while looking to see if the infections up to end Nov had any noticeable impact on the R rate in January – and the answer is no, in fact higher infection rates up to end Nov were, if anything, associated with higher R (ie. slower decline) in cases during January 9/n
We know from previous analysis that infection rates in each wave are linked to the human and physical geography of the local area e.g. deprivation, population density etc., and we can see this again in the R rates for each IMD decile in January 10/n
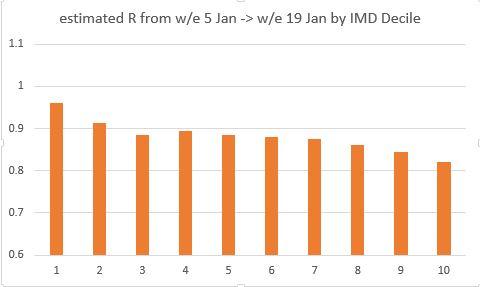
Note: IMD is a composite measure of deprivation, and decile 1 corresponds to the most deprived areas, with decile 10 being the least deprived. More info here: assets.publishing.service.gov.uk/government/upl… 11/n
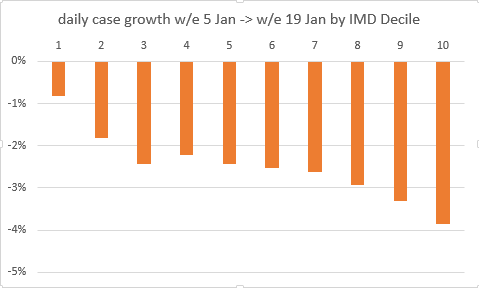
The pattern is perhaps even clearer when plotted as a daily growth rate: infections in the most deprived areas are only just falling (daily growth of -0.8%, R=0.96) whereas in the least deprived, infections are falling much faster (daily growth of -3.9%, R=0.82) 12/n
Many people have seen this pattern in their local areas, as the ‘posh’ bits turned light blue or green on the gov.uk map, while poorer areas remained purple (and thanks to @RDann15 for prompting me on this). But it’s helpful to see the stats back it up. 13/n
I have checked and the effect is also visible within each English region (albeit with more noise in the data), suggesting that it’s not just different timing of the wave 3 peak and decline in different regions of England causing this pattern to appear in the data 14/n
This is not just a problem for the most deprived local areas, because if we keep going like this, the inequality will widen over time. At present, the most deprived quintile (i.e. deciles 1 and 2 combined) accounts for c. 25% of all infections in England. 15/n
But if we project forward at constant R for 3 months (i.e. to mid-April), the infections nearly disappear in the least deprived areas, but only halve in the most deprived areas. And that most deprived quintile then accounts for over half of infections in England. 16/n
Of course, vaccines should come to our rescue and push R down faster over that period. But equally we will want to be relaxing restrictions at the same time, which will be much harder to do if in some areas, R and infection rates remain stubbornly high. 17/n & end
• • •
Missing some Tweet in this thread? You can try to
force a refresh


