NEW: UK has now passed 100,000 Covid-19 deaths according to three different measures:
• Deaths within 28 days of positive test
• Deaths where C-19 mentioned on death certificate
• Excess deaths above historical average
Story @GeorgeWParker@ChrisGiles_: ft.com/675d737e-88a5-…
The inclusion of excess deaths puts to bed any idea that the towering death toll is due to people testing positive for Covid but dying primarily for other reasons.
There have been 100,000 more deaths than in a typical year, and this is despite fewer deaths from many other causes
Looking at the three measures across the year:
• Shortage of testing in spring meant "deaths within 28 days" were always an undercount
• Even death certs may have missed thousands of deaths, with spring peak in excess deaths thought to be the best metric for the overall toll
More testing in winter means the "within 28 days of a positive" and death certificate measures have converged.
Excess deaths too are very high, but are lower than the other two measures, driven in large part by fewer deaths this winter from other causes.
Whatever metric you choose, the UK now has one of the worst Covid mortality rates worldwide.
NEW: white people in England aged 80+ are being vaccinated at twice the rate of black people, and rates in deprived neighbourhoods are lagging behind less deprived areas ft.com/content/a831fc…
The gaps are widening, suggesting fundamental challenges in ensuring equal protection
These inequalities are especially concerning given the disproportionate impact of Covid-19 on ethnic minority groups.
The very groups that are most at risk from the disease, are thus far the least likely to have received protection.
The findings come from a team of researchers including @bengoldacre, who analysed data from 23m people in England to explore patterns of vaccine coverage by demographics & socio-economics.
The analysis will be repeated weekly, and Ben explains more here
Somehow even 12 months into the pandemic, people are saying "yes but how many of those 100k UK deaths were due to Covid and how many were due to lockdowns?"
We have detailed contact tracing research showing that transmission is almost 20x lower outdoors than in medrxiv.org/content/10.110…
We have mobility data showing that individual behaviour and adherence to guidance remain very good on the whole, while it's workplaces where activity looks on the high side
NEW video from me & @tomhannen addressing more myths that have been used to play down Covid this winter.
Featuring:
• Why delays in death registration (& bad charts) wrongly led people to think there was minimal excess mortality
• "Excess winter deaths" are not "excess deaths"
For several weeks, some lockdown-sceptics have been sharing the EuroMOMO excess mortality charts which they say show we’re not seeing many more deaths than usual for the time of year.
A few days ago, EuroMOMO indeed showed deaths essentially back to normal in England. But...
Despite EuroMOMO stating that figures in recent weeks shaded in yellow have been "corrected for delays in [death] registration", this is clearly not the case.
Week after week, the line appears to be falling back to normal, but without fail it’s then revised upwards every time.
NEW: a common response to reports of hospitals struggling this winter is "it’s no different to a bad flu season!"
I’ve tracked down historical data on flu ICU admissions, including winter 2017-18, a record high.
Here’s how England’s Covid winter compares to a bad flu season 📹
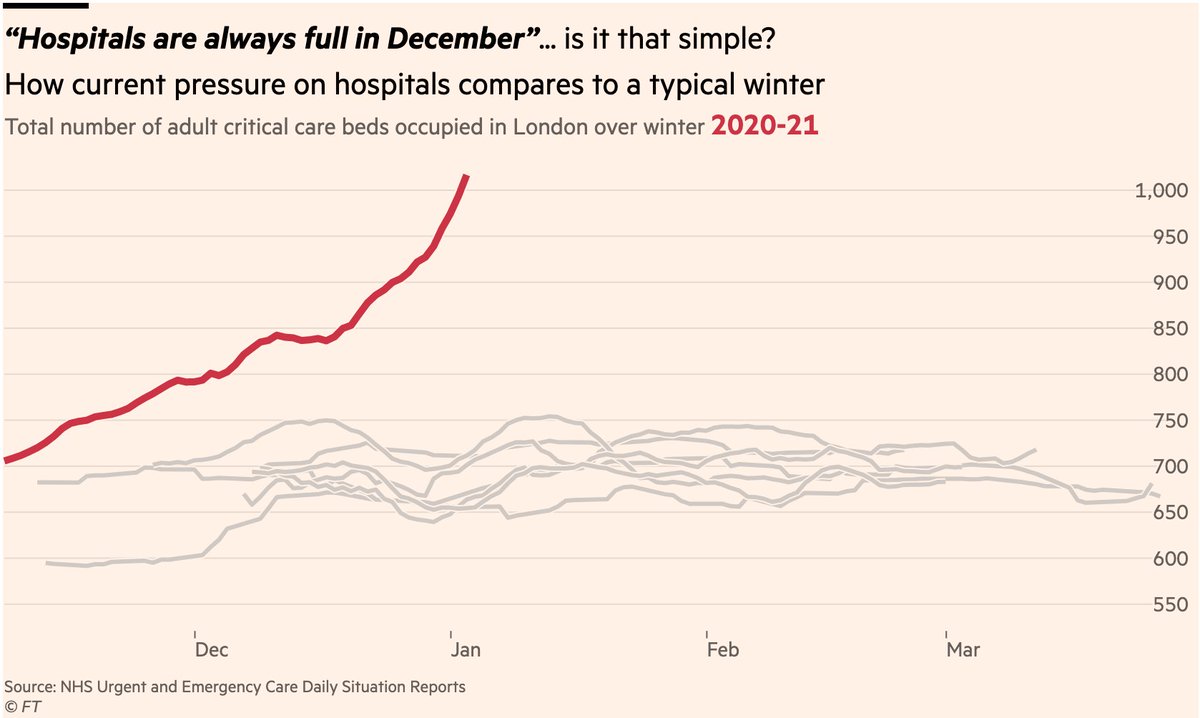
We can also address claims like "hospitals are always full in winter", or "it’s just people who were already in hospital for other reasons catching Covid on the ward"
Here are numbers of people in ICU beds (for any reason) in London hospitals, each winter
Spot the odd one out
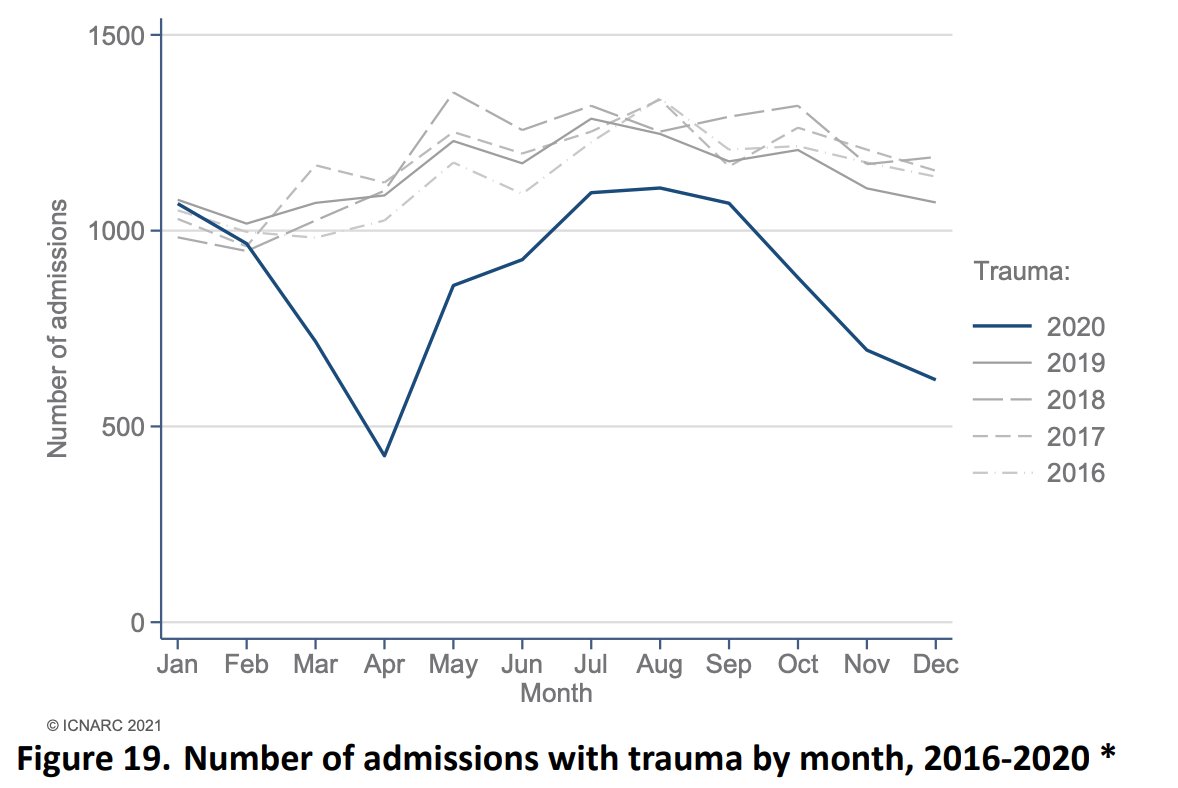
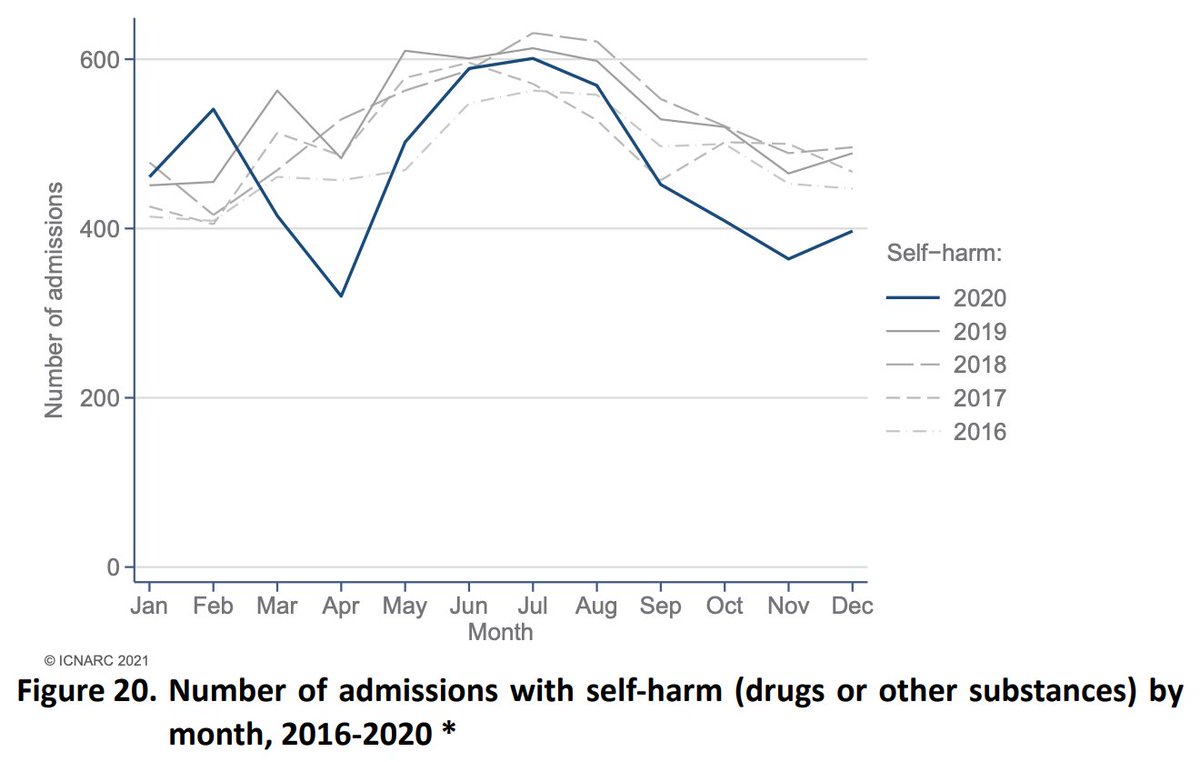
Unless there has been a coincidental 50% rise in ICU admissions for other reasons (narrator: there hasn’t
Now, some will inevitably say "but that’s just showing Covid spreading among people who were already in hospital for other reasons", but that is wrong.
Of the 17,900 new Covid cases in English hospitals since Christmas day, 15,072 were new admissions from the community, i.e 84%.
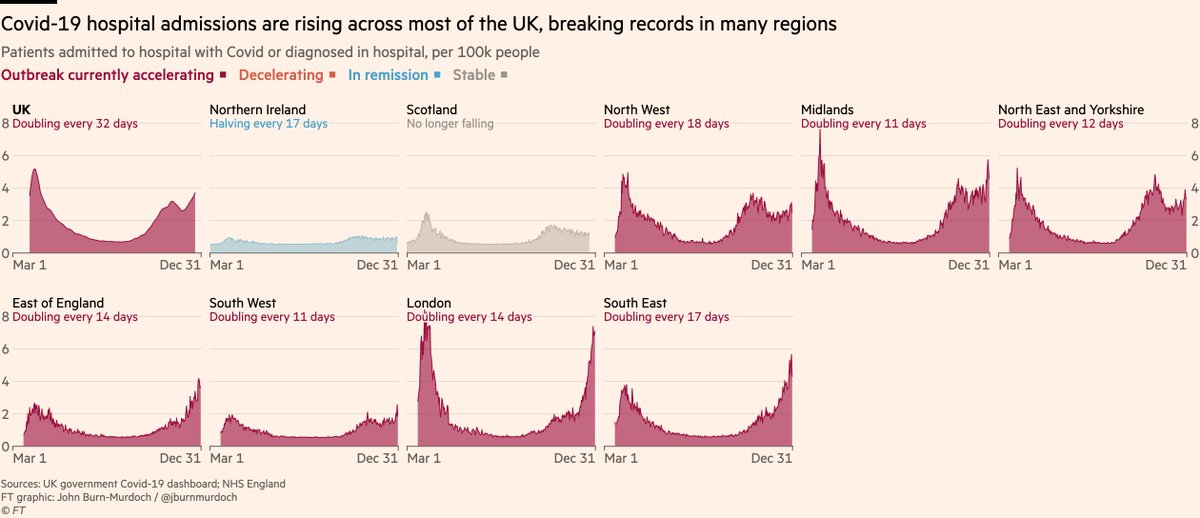
Here are hospital admissions for all UK regions (excl Wales where this data is not readily available).
Far from being only a London problem, new Covid admissions are now doubling in less than 2 weeks across 5 English regions.
And here’s what that means for Covid hospital occupancy:
Now increasing in every English region + Wales, and no longer falling in Scotland or Northern Ireland.