This is an interesting paper (and thread). I could have been expected to think it correct because it validates the models (well, one model), but there are a couple of issues that give me pause...
The new reconstruction is not based on any new data, but it calculates an adjustment to the existing ocean SST proxies (mostly Mg/Ca or alkenones) by examining how much those proxies change in a previous period - the Last Inter-Glacial (LIG) (around 125,000 years ago).
Those changes are assumed to be due to variations in the seasonal insolation (which was larger & more rapid at the LIG than in the Holocene). If the changes are most coherent w/one season than another, that is then applied to the Holocene records to get an estimated annual mean.
This method assumes some kind of linearity of response to seasonal insolation across the two interglacial periods, but doesn't show that the lifecycle/seasonal preference of forams involved would actually provide this response.
I will be looking for some forward modeling of the behaviour of these forams to validate this statistical technique. (Full disclosure, this is something I worked on ages ago, and I'd love to catch up with what's been done since. pubs.giss.nasa.gov/abs/sc09000a.h… )
• • •
Missing some Tweet in this thread? You can try to
force a refresh
There’s a good review article out today on the ‘Earth's ice imbalance’. Basically a thorough accounting of how ice is disappearing from the Arctic, Antarctic and mountain ranges. It includes land ice *and* floating ice. Bottom line? tc.copernicus.org/articles/15/23…
This is already affecting sea level rise, with a dominant contribution from mountain glaciers so far, but with growing and eventually dominant contributions from Greenland and Antarctica. Remember that SLR is lose-lose; there are no benefits to weighed against the costs.
But there is one error in the paper (and one which appears in many places), but also one that has been corrected over and again in discussions and the literature. The loss of floating ice (which is fresh) in a salty ocean *does* affect sea level.
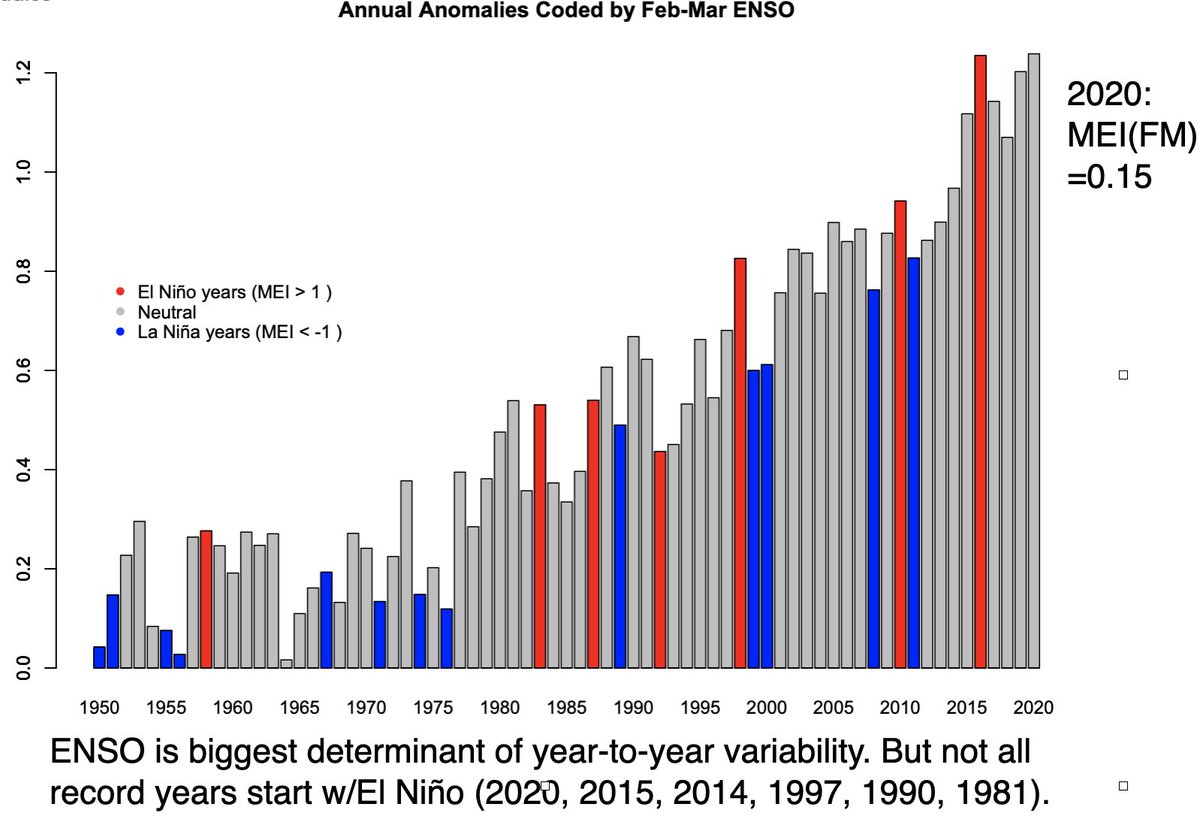
A bit more background on the temperature anomalies in 2020, which were statistically tied with 2016 for the warmest year in the instrumental record.
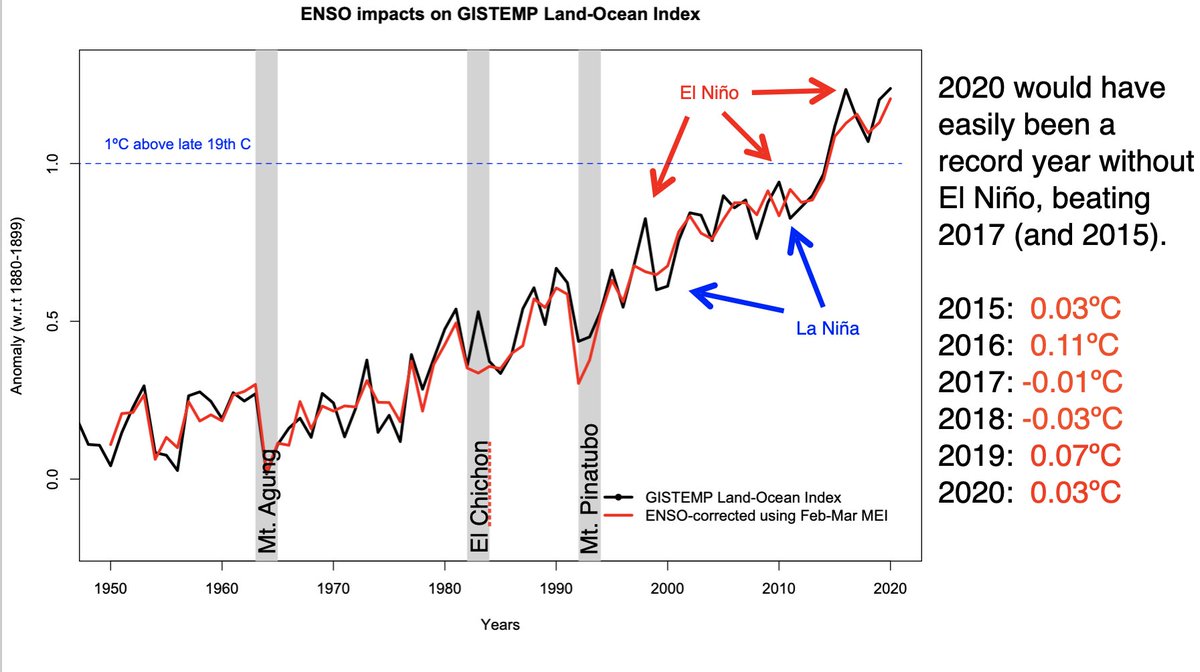
How big a deal is ENSO in these year to year variations?
We can quantify the impact via regression to the Feb/Mar ENSO index and produce an 'ENSO corrected' temperature series that has a clearer long term trend (and volcanic impacts).
To be clear, this is not good news. Greenland ice sheet is demonstrably out of balance with current temperatures. But it doesn't (necessarily) presage the collapse of the whole thing.
This is an analysis of 35 years of data, not a modeling study, and so while it can do a good job at attributing the current rates of loss to dynamic responses of the ice sheet, it says nothing about where the process would end up in the future under any plausible scenario.
Nonetheless, it is a very valid question (and subject of much research) to ask at what point the Greenland ice sheet is unviable.
From the Pliocene records, we know that a global mean of ~3ºC above the pre-industrial does not seem to be compatible with a substantial GIS.
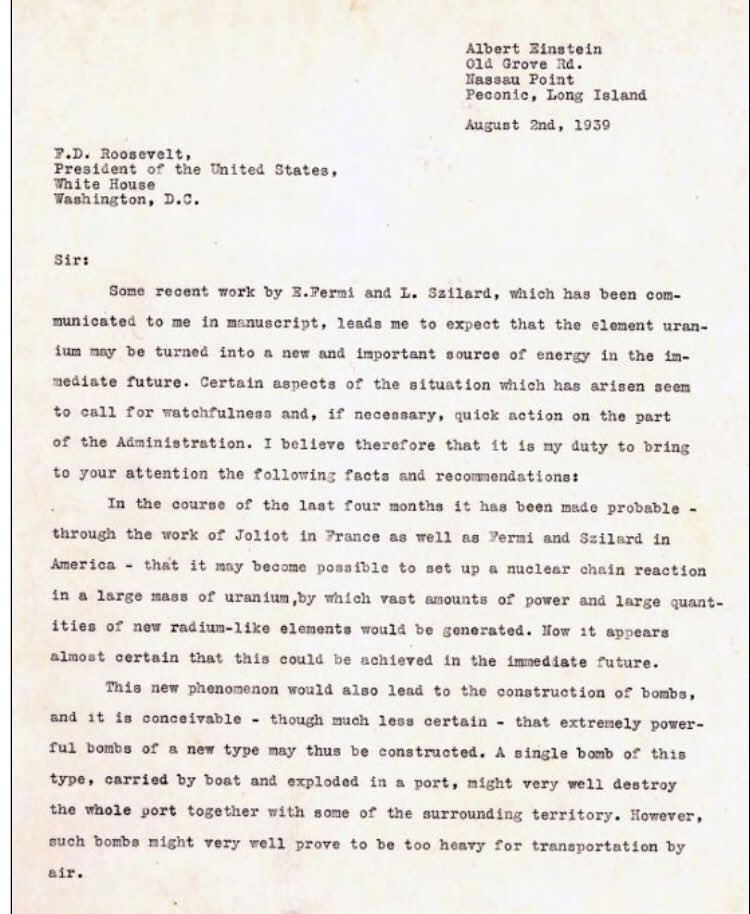
The effort by Ionannidis and scientific colleagues to directly influence the president on a matter of scientific policy is not unprecedented. There have been many attempts by other scientists to do so in the past. Some sucessful, some not & some w/unanticipated consequences…
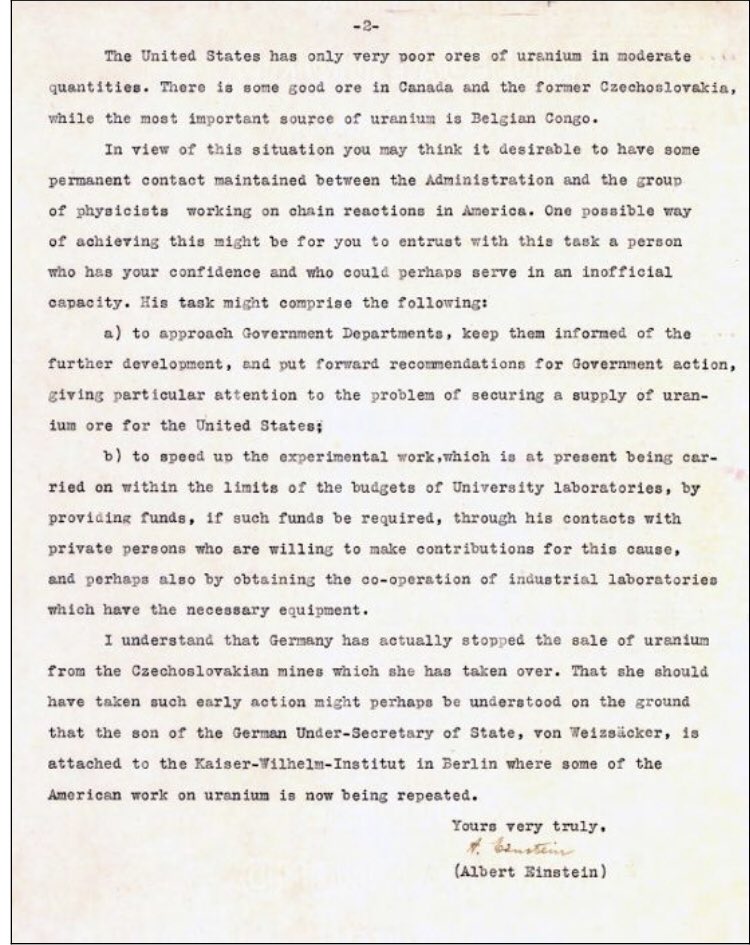
The most famous example is from Albert Einstein warming Roosevelt about the dangers of Germany developing an atomic bomb in 1939. dannen.com/ae-fdr.html
But note that large scale efforts in the US (that became the Manhattan project) did not happen for another two years, after Pearl Harbor.
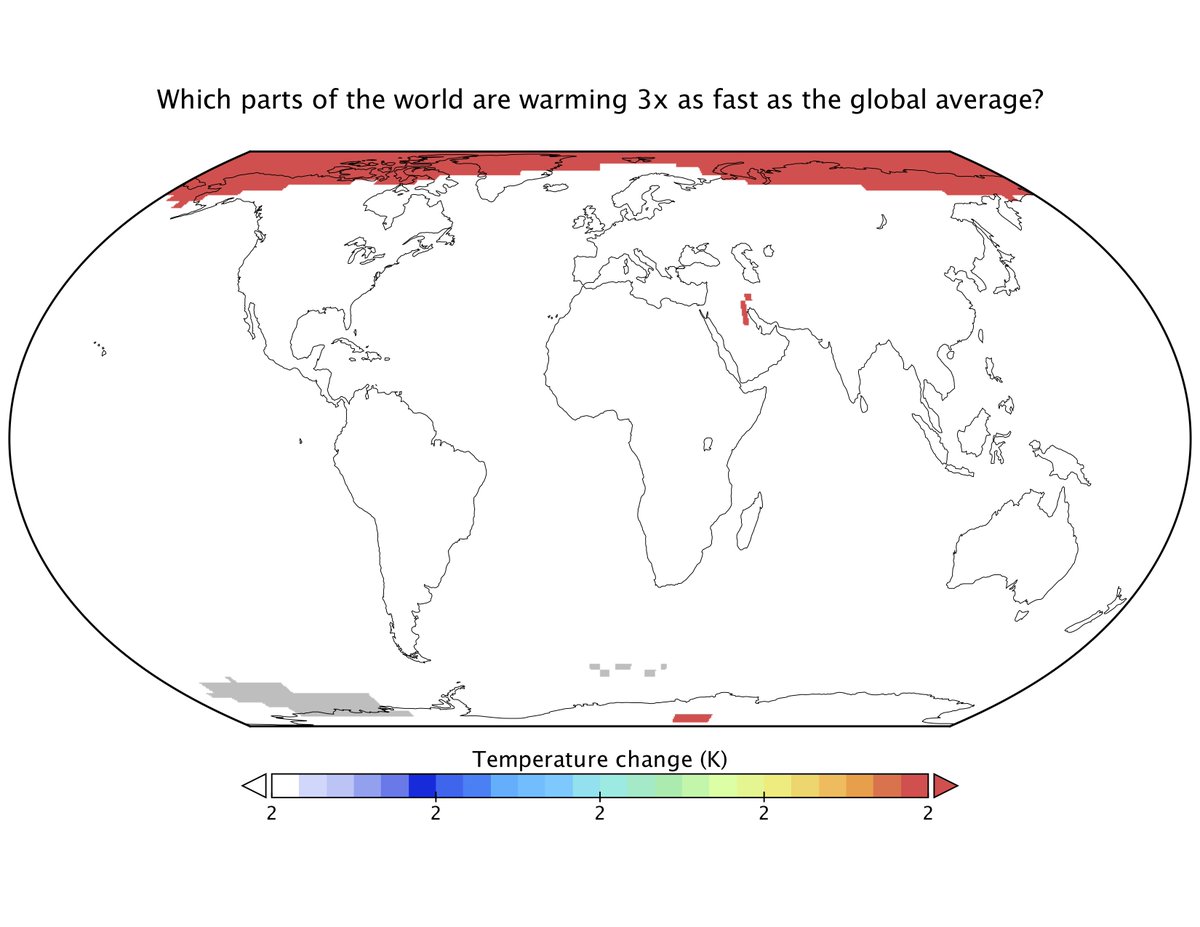
The Arctic warming is getting a lot of attention this week, but I keep seeing references to the warming being twice as fast as the global mean, and that's not right.
It's more like 3 times the global mean.
GISTEMP Global mean warming 1970-2019: 0.95ºC (±0.1ºC, 95% CI)
Arctic warming (64ºN-90ºN): 2.94ºC (±0.4ºC, 95% CI)
Cowtan & Way Global mean warming 1970-2019: 0.92ºC (±0.09ºC, 95% CI)
Arctic warming (65ºN-90ºN): 3.0ºC (±0.4ºC, 95% CI)
Ratio: 3.3 ± 0.6
The similarity of discussion/constraints on the Infected Fataility Rate (IFR) for covid-19 and the Equilibrium Climate Sensitivity (ECS) for carbon dioxide, is interesting.
Both IFR and ECS are model variables that have profound implications for policy but that aren’t directly measurable.
It’s easiest to think of them as constants, but there is a suspicion that they may vary depending on context (background climate for ECS, specific populations for IFR).