A bit more background on the temperature anomalies in 2020, which were statistically tied with 2016 for the warmest year in the instrumental record.
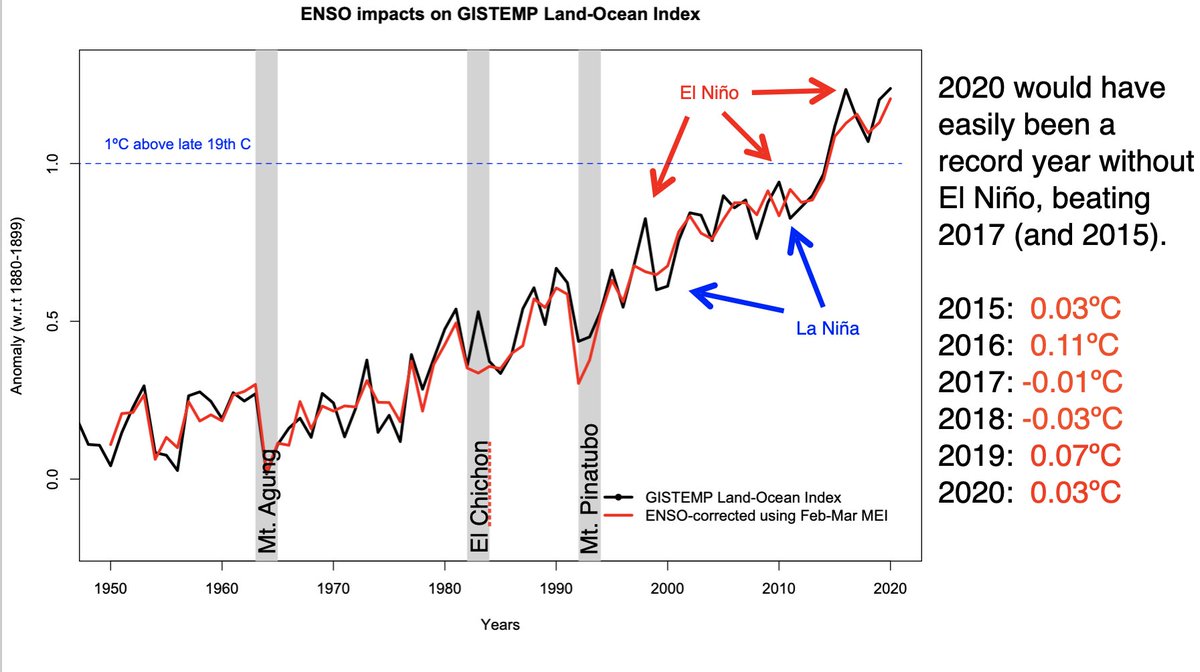
How big a deal is ENSO in these year to year variations?
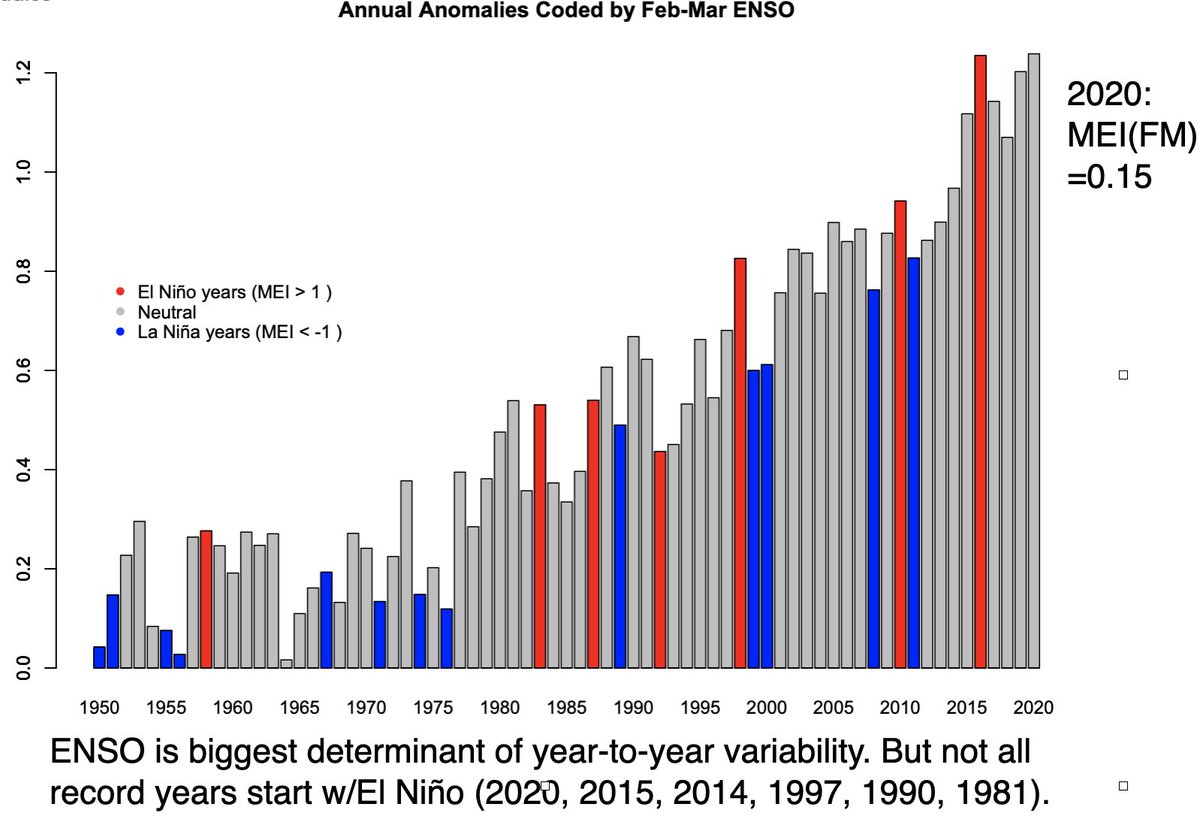
We can quantify the impact via regression to the Feb/Mar ENSO index and produce an 'ENSO corrected' temperature series that has a clearer long term trend (and volcanic impacts).
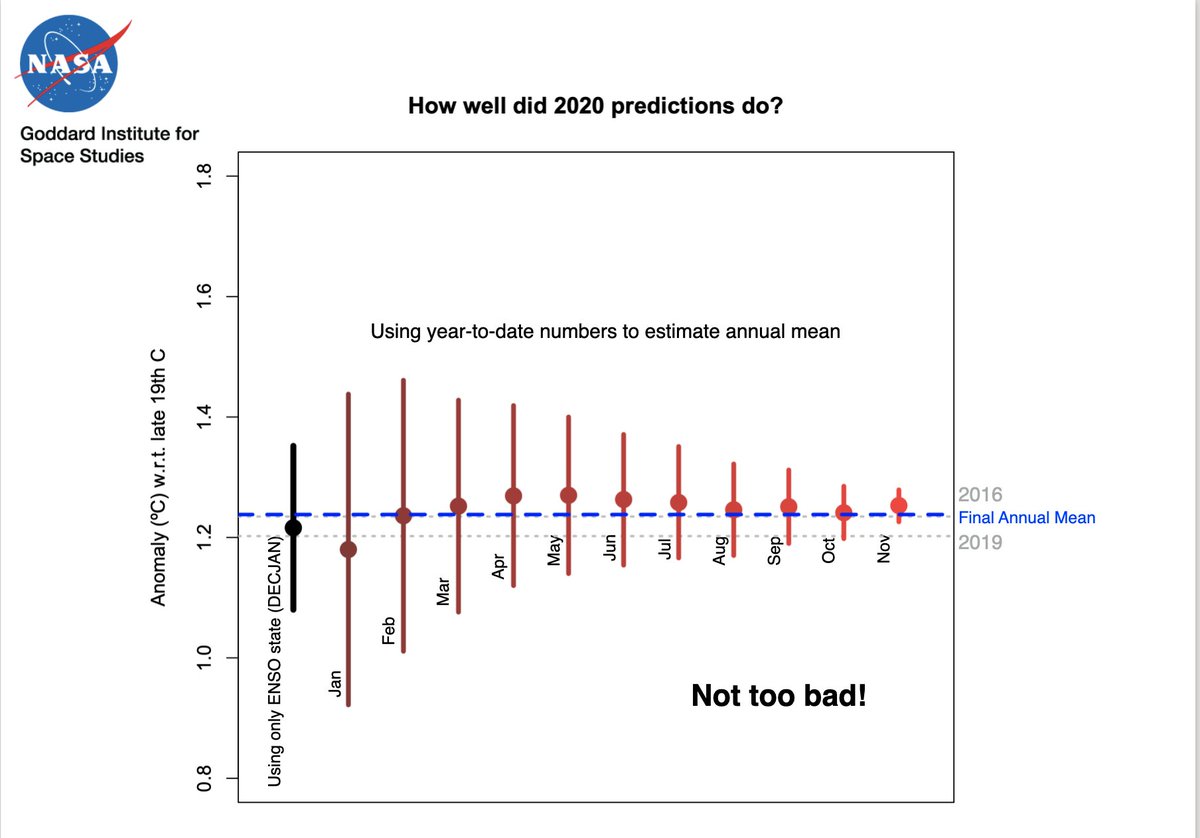
This dependence on winter/spring ENSO can be used to predict the annual temperatures a year ahead of time, and as the year progresses we can estimate the eventual annual number. How did we do?
How do the multiple indices stack up? Some very minor differences (getting smaller each year), but the same basic picture.
How robust is the ranking in a year like 2020? Not very - it's basically a toss-up - some groups (GISS, RSS) have #1, others #2. But in all cases the difference is much smaller than the estimated margin of error (~0.05ºC, 95% CI).
If anyone has any specific plots/analyses done, just let us know. Thanks!

• • •

Missing some Tweet in this thread? You can try to force a refresh
 

Keep Current with Gavin Schmidt

Gavin Schmidt Profile picture

Stay in touch and get notified when new unrolls are available from this author!

Read all threads

This Thread may be Removed Anytime!

PDF

Twitter may remove this content at anytime! Save it as PDF for later use!

Try unrolling a thread yourself!

how to unroll video
  1. Follow @ThreadReaderApp to mention us!

  2. From a Twitter thread mention us with a keyword "unroll"
@threadreaderapp unroll

Practice here first or read more on our help page!

More from @ClimateOfGavin

17 Aug 20
A lot of interest in the Greenland ice loss study from King et al. nature.com/articles/s4324…

To be clear, this is not good news. Greenland ice sheet is demonstrably out of balance with current temperatures. But it doesn't (necessarily) presage the collapse of the whole thing.
This is an analysis of 35 years of data, not a modeling study, and so while it can do a good job at attributing the current rates of loss to dynamic responses of the ice sheet, it says nothing about where the process would end up in the future under any plausible scenario.
Nonetheless, it is a very valid question (and subject of much research) to ask at what point the Greenland ice sheet is unviable.

From the Pliocene records, we know that a global mean of ~3ºC above the pre-industrial does not seem to be compatible with a substantial GIS.
Read 10 tweets
25 Jul 20
The effort by Ionannidis and scientific colleagues to directly influence the president on a matter of scientific policy is not unprecedented. There have been many attempts by other scientists to do so in the past. Some sucessful, some not & some w/unanticipated consequences…
The most famous example is from Albert Einstein warming Roosevelt about the dangers of Germany developing an atomic bomb in 1939. dannen.com/ae-fdr.html
But note that large scale efforts in the US (that became the Manhattan project) did not happen for another two years, after Pearl Harbor.
Read 15 tweets
26 Jun 20
The Arctic warming is getting a lot of attention this week, but I keep seeing references to the warming being twice as fast as the global mean, and that's not right.

It's more like 3 times the global mean.
GISTEMP Global mean warming 1970-2019: 0.95ºC (±0.1ºC, 95% CI)
Arctic warming (64ºN-90ºN): 2.94ºC (±0.4ºC, 95% CI)
Cowtan & Way Global mean warming 1970-2019: 0.92ºC (±0.09ºC, 95% CI)
Arctic warming (65ºN-90ºN): 3.0ºC (±0.4ºC, 95% CI)
Ratio: 3.3 ± 0.6
Read 4 tweets
21 May 20
The similarity of discussion/constraints on the Infected Fataility Rate (IFR) for covid-19 and the Equilibrium Climate Sensitivity (ECS) for carbon dioxide, is interesting.
Both IFR and ECS are model variables that have profound implications for policy but that aren’t directly measurable.
It’s easiest to think of them as constants, but there is a suspicion that they may vary depending on context (background climate for ECS, specific populations for IFR).
Read 12 tweets
30 Jan 20
How to judge the importance of scientific critiques? Use a necessary edits scale:

4* Big deal: All papers to be rewritten from scratch
3* Important: Major revisions in many papers
2* Notable: Some sections reframed
1* Inconsequential: A sentence or two edited
Where does the @hausfath + @Peters_Glen commentary on RCP85 lie on this spectrum?

nature.com/articles/d4158…
Delete: 'business-as-usual' (an ambiguous phrase at the best of times).
Replace with: "high end scenario"/"Burn it all"/"worst case scenario".
No other change required.

So that would be... a 1* effect. 🥱
Read 5 tweets
16 Jan 20
Since this comes up a lot, a quick run though of the testable, falsifiable, science that supports a human cause of recent trends in global mean temperature.
First off, we start with the observations:
1) spectra from space showing absorption of upward infra-red radiation from the Earth's surface.
2) Measurements from around the world showing increases in CO2, CH4, CFCs, N2O.
3) In situ & space based observations of land use change
We develop theories.
1) Radiative-transfer (e.g. Manabe and Wetherald, 1967)
2) Energy-balance models (Budyko 1961 and many subsequent papers)
3) GCMs (Phillips 1956, Hansen et al 1983, CMIP etc.)
Read 11 tweets

Did Thread Reader help you today?

Support us! We are indie developers!


This site is made by just two indie developers on a laptop doing marketing, support and development! Read more about the story.

Become a Premium Member ($3/month or $30/year) and get exclusive features!

Become Premium

Too expensive? Make a small donation by buying us coffee ($5) or help with server cost ($10)

Donate via Paypal Become our Patreon

Thank you for your support!

Follow Us on Twitter!