Quick thread on $AMZN valuation.

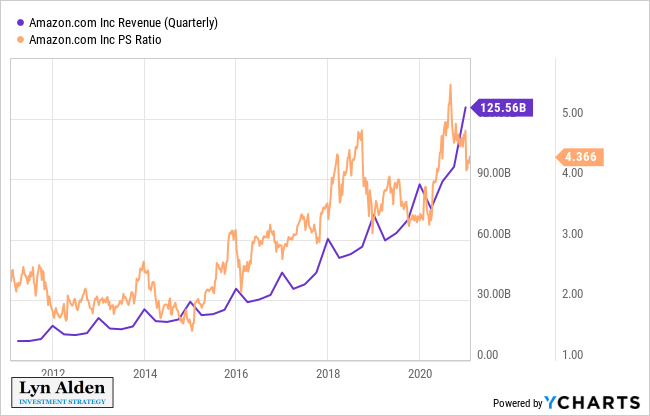
From a price to sales perspective, it remains elevated compared to its history:
However, operating cash flow has grown more quickly than revenue.

From a price to cash flow perspective, Amazon is near the mid-to-low end of its historical valuation range:
Amazon stock has followed a 25x operating cash flow multiple almost like clockwork for nearly two decades.

Chart via @FASTGraphs
My base case would be for a consolidation and then move higher over the next 3 years, but the big variable that could derail the valuation narrative would be notably higher treasury rates.

• • •

Missing some Tweet in this thread? You can try to force a refresh
 

Keep Current with Lyn Alden

Lyn Alden Profile picture

Stay in touch and get notified when new unrolls are available from this author!

Read all threads

This Thread may be Removed Anytime!

PDF

Twitter may remove this content at anytime! Save it as PDF for later use!

Try unrolling a thread yourself!

how to unroll video
  1. Follow @ThreadReaderApp to mention us!

  2. From a Twitter thread mention us with a keyword "unroll"
@threadreaderapp unroll

Practice here first or read more on our help page!

More from @LynAldenContact

22 Jan
Ethereum folks including @BanklessHQ and @VitalikButerin crowdsourced a response to my Ethereum article:

newsletter.banklesshq.com/p/open-reply-t…
Some responses are fair (e.g. the hash rate chart wasn't ideal), while other ones I still view differently.

The core thesis of my article (Eth still very early on in development; changing the underlying structure while building on top of it) doesn't appear to be disagreed with.
Another paper I would direct folks to is this one: s3.eu-west-2.amazonaws.com/john-pfeffer/A…

Three years old but still highly relevant (and arguably playing out a bit at this point).

TLDR: token appreciation (mkt cap) and ecosystem growth (trans volume) not necessarily correlated long-term.
Read 5 tweets
18 Jan
My recent article on Ethereum provoked a lot of responses in favor and against, which is good.
lynalden.com/ethereum-analy…

One of my goals is to identify what is an institutional-grade blockchain, and what is not yet one.
For example, when I bought BTC in April 2020 at $6.9k, this ended up being right ahead of a wall of institutional money that came into BTC throughout the year.

The risk/reward ratio was very strong. Not the highest absolute return (could have bought TSLA yolo calls), but great.
More importantly, I like the BTC project, the ecosystem, what it enables, and the options that it gives to people around the world.

Permissionless payments and self-custody stores of value are important for the world to have.
Read 9 tweets
9 Jan
There’s an old Zen koan that goes, “if you meet the Buddha, kill him.”

In other words, when something is self-verifiable or self-iterating, looking too heavily towards the originator can be a distraction along the path. Results speak for themselves.
Some folks have applied that to Bitcoin as well.


For example, sometimes there are debates about Satoshi Nakamoto’s original intent. Should block sizes be increased to facilitate “e-cash” or should block sizes be kept small for any user to run a node?
This is the type of problem encountered by engineers all the time: trade-offs.

A project can iterate or stay the same depending on what the market says.
Read 15 tweets
8 Jan
Imagine a thought experiment:

The Federal Reserve Act gets changed, and the Fed is able to print dollars to buy Treasuries directly from the Treasury, rather than on the secondary market.
Congress says “awesome!”, and decides to send everyone $5k stimulus checks. They sell the Treasuries directly to the Fed, and the Fed buys them with electronically-printed money. No banks as intermediaries, no secondary market purchases.
The stimulus checks get deposited by the Treasury into everyone’s bank account. Their banks then get the cash as an asset, and have new deposit liabilities to their depositors in equal amount. The money is freely spendable by the consumers.
Read 6 tweets
7 Jan
This article assumes banks are reserve constrained, but they're usually not reserve constrained.

In 2020, bank holdings of Treasuries, MBS, cash at the Fed, and loans, *all* went up.
When the government runs large fiscal deficits, and the Fed buys the Treasuries on the secondary market, it sends bank deposits (M2) up a lot, which increases their capital base to buy even more Treasuries or make more loans.

No deflationary "crowding out" effect.

Reflationary.
More about the mechanics of this here:
lynalden.com/money-printing/
Read 5 tweets
3 Jan
When interest rates hit zero for the first time in decades, interesting things happen.

Here's the 100-year chart of total debt to GDP in blue on the left axis, vs interest rates in orange on the right axis. Total debt includes public and private debt.
Another way of looking at it is total debt as a % of M2.

With this metric, we can see the big changes since 2008 in particular. The ratio dropped from 700% to 400% in 12 years.
If we separate out federal debt vs nonfederal debt as a percentage of GDP, it also provides more clarity.

In each long-term cycle, the first stage was a private debt bubble and banking crisis, while the second stage was a public debt bubble and massive M2 increase.
Read 5 tweets

Did Thread Reader help you today?

Support us! We are indie developers!


This site is made by just two indie developers on a laptop doing marketing, support and development! Read more about the story.

Become a Premium Member ($3/month or $30/year) and get exclusive features!

Become Premium

Too expensive? Make a small donation by buying us coffee ($5) or help with server cost ($10)

Donate via Paypal Become our Patreon

Thank you for your support!

Follow Us on Twitter!