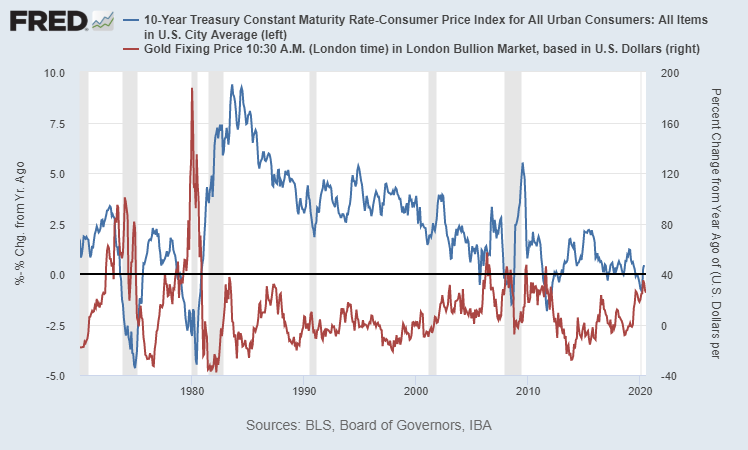
When interest rates hit zero for the first time in decades, interesting things happen.

Here's the 100-year chart of total debt to GDP in blue on the left axis, vs interest rates in orange on the right axis. Total debt includes public and private debt.
Another way of looking at it is total debt as a % of M2.

With this metric, we can see the big changes since 2008 in particular. The ratio dropped from 700% to 400% in 12 years.
If we separate out federal debt vs nonfederal debt as a percentage of GDP, it also provides more clarity.

In each long-term cycle, the first stage was a private debt bubble and banking crisis, while the second stage was a public debt bubble and massive M2 increase.
Lastly, we can look at the monetary base as a percentage of GDP. When rates hit zero, monetary policy shifts to increasing the monetary base instead (aka QE).
More charts here:
lynalden.com/fiscal-and-mon…

What has been will be again, what has been done will be done again; there is nothing new under the sun.

• • •

Missing some Tweet in this thread? You can try to force a refresh
 

Keep Current with Lyn Alden

Lyn Alden Profile picture

Stay in touch and get notified when new unrolls are available from this author!

Read all threads

This Thread may be Removed Anytime!

PDF

Twitter may remove this content at anytime! Save it as PDF for later use!

Try unrolling a thread yourself!

how to unroll video
  1. Follow @ThreadReaderApp to mention us!

  2. From a Twitter thread mention us with a keyword "unroll"
@threadreaderapp unroll

Practice here first or read more on our help page!

More from @LynAldenContact

20 Dec 20
This cycle of dollar strength was created by the end of QE in mid-2014, and the initiation of QT in early 2018, all of which made US monetary policy relatively tight vs peers.

The cycle of strength is seemingly ending, on the cessation of QT into indefinite QE, from late 2019.
The US runs persistent current account deficits (weak FX), while Europe and Japan run current account surpluses (strong FX).

The dollar's strength, therefore, mainly comes from tight monetary policy, along with the global offshore USD debt that represents persistent demand.
So, when fiscal and monetary policy in the US become loose, the USD historically has plenty of room to fall.

USD demand remains relatively steady year-to-year, while USD supply rapidly shifted from tightening to loosening over the past 16 months.
Read 4 tweets
17 Oct 20
New Treasury holders report out yesterday. The foreign sector slightly reduced U.S. Treasury holdings in Aug, from July, despite ongoing large issuance.

YTD through August, the foreign sector only bought about 5% of net new Treasury issuance.
We know from Fed custody data, which is incomplete but faster-updating, that going into October, the foreign sector still isn't really buying Treasuries in size:
About 2/3rds of net new U.S. Treasury issuance this year was bought by the combo of the Fed and U.S. banking system.

There's very little foreign demand. There's moderate non-bank domestic demand, but not enough vs the massive issuance (at least at current prices).
Read 4 tweets
1 Aug 20
It's a common view that QE leads to wealth inequality, and this view is largely justified.

Here's a weird fact though: Between Japan, Europe, China, and the United States, there is an *inverse* correlation between the amount of QE they did as a % of GDP, and wealth inequality.
Japan did the most QE in terms of how long they did it, and what percentage of GDP they did it. And yet, they have among the lowest inequality, and the share of assets among the top 1% actually deceased over the span of doing it.
On the other hand, the U.S. did the least QE as a percentage of GDP, and yet has the highest wealth inequality among major developed nations.

China and Europe performed middling amounts of QE as a percentage of GDP, and have middling wealth inequality.
Read 4 tweets
3 Jul 20
This chart shows the price of gold vs broad money supply per capita, normalized to 100 in 1973, on the left axis.

On the right axis, is the inflation-adjusted interest rate of the U.S. 10-year Treasury note.
Over the past ~50 years, gold's price rose at about the same rate as monetary inflation per capita (which is not the same as price inflation).

It tended to overshoot that trend during periods of low real rates, and undershoot that trend during periods of high real rates.
Gold's price in year-over-year terms tends to inversely correlate with the inflation-adjusted 10-year yield.

When real rates are positive, the opportunity cost for owning gold is high. When real rates are low/negative, it makes more sense to have gold exposure.
Read 5 tweets
19 Jun 20
Here’s a new thread on the dollar, swap lines, and the treasury market. With lots of charts.🧐

AKA “Why the global dollar shortage is not insurmountable.”
There is $250+ trillion of debt in the world.

Of this, over $50T is USD debt by American households, nonfinancial corporations, and the govt.

Much of the rest is debts for other countries in other currencies.
However, governments and nonfinancial corporations outside of the U.S. also hold $12+ trillion in USD-denominated debt, since it’s the most-used global currency.

And they rely on USD-based global trade to get dollars to service those debts.
Read 26 tweets
15 Jun 20
New foreign-sector Treasury holding data out today; for the month of April (comes with a lag).

From Feb-end through April-end, the foreign sector sold over $300 billion in U.S. Treasuries.
This likely bottomed in April, based on Fed Treasury custody data which comes out weekly (less complete data set, but much shorter lag).

When swap lines ramped up to provide USD liquidity, the foreign sector stopped selling Treasuries, and has since been buying some. Image
The Treasury issued like $3 trillion in net Treasuries YTD, with very little purchased by the foreign sector. The majority of the issuance went onto the Fed's balance sheet.

The Fed accumulated more Treasuries in March and April than the foreign sector has in six years.
Read 4 tweets

Did Thread Reader help you today?

Support us! We are indie developers!


This site is made by just two indie developers on a laptop doing marketing, support and development! Read more about the story.

Become a Premium Member ($3/month or $30/year) and get exclusive features!

Become Premium

Too expensive? Make a small donation by buying us coffee ($5) or help with server cost ($10)

Donate via Paypal Become our Patreon

Thank you for your support!

Follow Us on Twitter!