One reason I am sceptical about impact of Tier 3&4 is decline in infections from end-Dec is part of the normal longer run trend we see v. often: when cases rise, rate of growth increases, then declines & eventually goes negative. A bit like R declining but still > 1 for a while.
Here is rate of growth for Zoe estimates for England.

Growth rate turns -ve (i.e. estimated infections start to fall) on data from 3 Jan (implying infections falling perhaps 5-6 days earlier). But growth rate started falling from 16 Dec, i.e. before school hols or Tier 4.
V. little sign of tier changes/lockdown accelerating the trend. In fact, the inflection point around 23-28th Dec happens just when effect of school holidays/T3 then T4 in London/SE/E might have kicked in. Similarly, no sign of any accelerating of trend after lockdown.
Regional effects might be hiding things, so here is the trend in the growth rate for the worst hit region, London.

Infections start falling from 30 Dec so too late for T3/T4/school holidays to be the trigger, whilst growth rate starts falling from 17th too early for even T3.
Most that can be said is that the London growth rate does fall more quickly from about the 20th which could possibly be attributed to T3 change on 16th. No sign of any T4 impact.
For comparison, here is Yorkshire: growth rate peaks later than London (27 Dec) & falls steadily from 30 Dec, too early for 31 Dec tier changes to be the trigger. Growth rate turns –ve (i.e. infections fall) on 4 Jan but this is a continuation of the earlier trend in growth rate.
Note, Yorkshire region was never in Tier 4. It was a mix of Tier 2 & Tier 3 up to 31st Dec and all in Tier 3 from then until national LD.
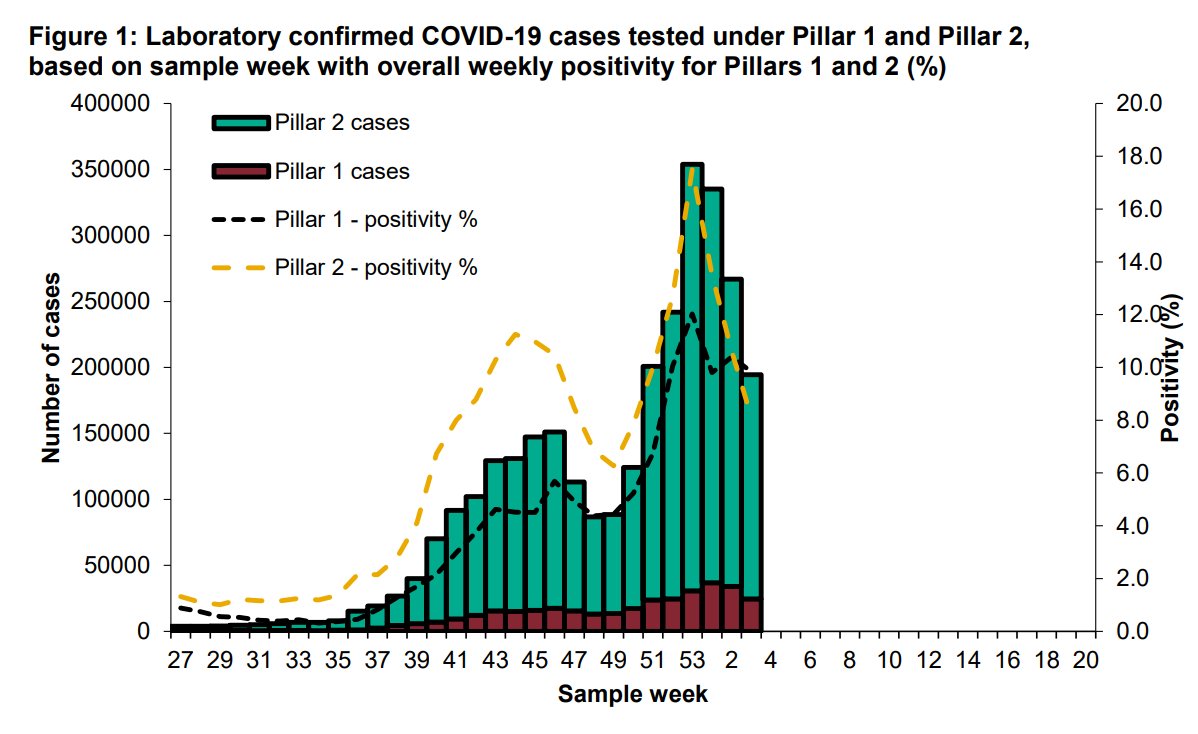
BTW I’ve used the Zoe data as it is less affected by Christmas testing/reporting anomalies than is the PHE case data, but the latter tells a fairly similar story.

Data source is here: console.cloud.google.com/storage/browse…

• • •

Missing some Tweet in this thread? You can try to force a refresh
 

Keep Current with David Paton

David Paton Profile picture

Stay in touch and get notified when new unrolls are available from this author!

Read all threads

This Thread may be Removed Anytime!

PDF

Twitter may remove this content at anytime! Save it as PDF for later use!

Try unrolling a thread yourself!

how to unroll video
  1. Follow @ThreadReaderApp to mention us!

  2. From a Twitter thread mention us with a keyword "unroll"
@threadreaderapp unroll

Practice here first or read more on our help page!

More from @cricketwyvern

5 Feb
This is an interesting response by @cjsnowdon to @toadmeister but many of the examples he cites do not support his argument that infections start falling after lockdowns.

Here’s a closer look at 3 of them: France (31st Oct), Ireland (24th-31st Dec) & England (5th Nov)
1. France: 7-day cases were falling from 3rd Nov (not the 8th as @cjsnowdon states), positivity from 2nd, hospitalisations from the 5th. Given lag, these all show infections falling well before 31st October ...
France's estimated R-rate started falling from 24 Oct & there is no indication lockdown accelerated the decrease.

The 31st October French lockdown is not a good example of lockdown effectiveness.
Read 13 tweets
4 Feb
A self-proclaimed fact checking website run by a Conservative MP & Govt policy advisor still states “Cases were not falling before the January 2021 lockdown”. They refer to 3 pieces of evidence ...
... 1. Weekly positive test data:

Weekly data obscures the daily peak but even so, PHE surveillance show peak was in wk 53 (28 Dec-3 Jan), i.e. pre-national lockdown, consistent with the daily data. assets.publishing.service.gov.uk/government/upl…
2. "ONS infection survey ... rose to 1 in 50 by Jan 2 2021":

they don’t clarify this is prevalence (total currently infected) which will peak much later than incidence (new infections). As it happens, ONS daily estimates suggest even prevalence peaked pre-lockdown.
Read 6 tweets
31 Jan
Two things annoy me a little in the school debate. First, well-intentioned comments like "schools should be last to close & first to open".

We never debate when supermarkets should close. It is just accepted that they are essential & must stay open. So it should be with schools.
Second is the suggestion that there should be a trade off: if schools stay open something else has to close.

That reasoning assumes schools being open plays a significant role in infection spread. In fact, the evidence for that is, at best, weak. e.g.:
Read 8 tweets
21 Jan
In his recent article, @cjsnowdon claims that England's November lockdown was a good example of lockdown effectiveness. Let’s look at that claim using the ONS death-by-date registration data which have now been updated for the relevant period.
Although there is some uncertainty over the average lag between infections and death, we should expect any effect of lockdown to be visible in the deaths series after about three weeks.
If the 5th November lockdown had been effective, we might expect a beneficial effect on the deaths trend from about 26 Nov and an adverse effect from about 23 Dec, reflecting the relaxation on 2 Dec.

So what actually happened?
Read 10 tweets
19 Jan
Update to Sweden.

Now Christmas testing/reporting effects have worked through, we can see a decrease in positive tests of > 40% since peak just before Christmas.

ICUs also coming down steadily. We can expect deaths to follow though backdating means it is hard to be sure yet. ImageImageImage
Sweden has introduced some more measures over recent months, though nothing like those seen in UK & elsewhere, e.g.:

24 Nov: ban on more than 8 people gathering
7 Dec: schools for 16+ shut
18 Dec: mask guidance (not law) on public transport
24 Dec: some restrictions on bars
Taking account of the lag from infections, the positive test & ICU data suggest infections peaked around 16th December.

Definitely too late for gatherings to be the cause. Probably too late for schools. Clearly too early for the mask guidance or bar restrictions.
Read 5 tweets
18 Jan
Some people have been worried about high numbers of pupils attending schools since 4 Jan.

Children are (generally) not at risk of serious illness but concern was new variant wd cause fast spread in children, which cd then spill over to others.

We now some early data to look at.
First positive tests (7-day ave) for 5-9 & 10-14s. Allowing a 7-day lag to test, infections seem to increase during 1st part of holidays (but beware Christmas testing effects), then decrease from end of Dec. Early days, but so far looks like the decrease has continued since 4 Jan
Next NHS Covid-19 triage for U19s. Lag probably shorter than for tests.

7-day ave trend suggests infections leading to triage decrease before schools shut for Christmas, level off during holidays & then decrease again from about 4 Jan.

(Thanks to @dontbetyet for the chart)
Read 4 tweets

Did Thread Reader help you today?

Support us! We are indie developers!


This site is made by just two indie developers on a laptop doing marketing, support and development! Read more about the story.

Become a Premium Member ($3/month or $30/year) and get exclusive features!

Become Premium

Too expensive? Make a small donation by buying us coffee ($5) or help with server cost ($10)

Donate via Paypal Become our Patreon

Thank you for your support!

Follow Us on Twitter!