A note on reproducible GIS by economists: it's mostly absent. Here are some tips.
Reproducibility means that the inputs and methods can be repeated by a (somewhat) knowledgeable person. For GIS, that *might* (should) mean code, but it *definitely* means at least SOME instructions. Even if they are manual....
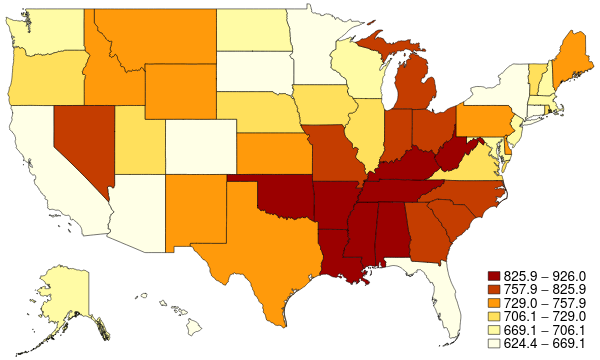
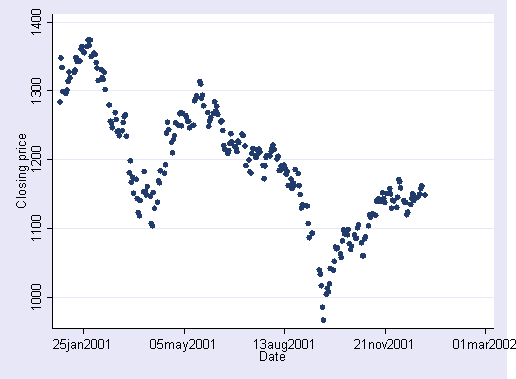
Maps are data. While your typical Stata/Matlab/R/Julia graph is data projected into Cartesian coordinates, maps are data projected into geographic coordinates. So at a minimum, we need to know what the inputs to the map are, same as we need to know inputs to graphs.
So "data + code" + "graph twoway scatter x y" -> 📈📉, and "data + code" + "maptile x, geo(state)" -> 🗺️. Or "data + code" + "instructions(ArcGIS)" -> 🗺️. Note that for a map, "data" includes shapefiles (including provenance of the shapefile) 
So: checklist for reproducible maps:
✅ data (+ provenance)
✅ code (manipulates data)
✅ shapefile (provides coordinates)
✅ code (preferred) or instructions (sufficient)
✅ data (+ provenance)
✅ code (manipulates data)
✅ shapefile (provides coordinates)
✅ code (preferred) or instructions (sufficient)
A few tentative resources (please improve!): social-science-data-editors.github.io/guidance/guida… with some other links below
#R sf staff.washington.edu/phurvitz/r_gis/ and interactions with GIS software (and integrated as a dependency into many great packages)
@SciPyTip GeoPandas geopandas.org and others
@ArcGISPro can also be scripted (python) and integrate notebooks pro.arcgis.com/en/pro-app/arc…
Staying #opensource: @qgis has "Graphical Modeler" docs.qgis.org/3.10/en/docs/u… and look for tutorials on "Automating GIS Workflows" courses.spatialthoughts.com
Summary: Please try to create scripted maps, but always describe what data you are mapping, and where you got the shapefiles from (note: copyrights might apply, permissions might need to be obtained!)
PS I summed it up at aeadataeditor.github.io/posts/2021-02-…
• • •
Missing some Tweet in this thread? You can try to
force a refresh