
🚨 new paper on labor market & expanded UI benefits 🚨
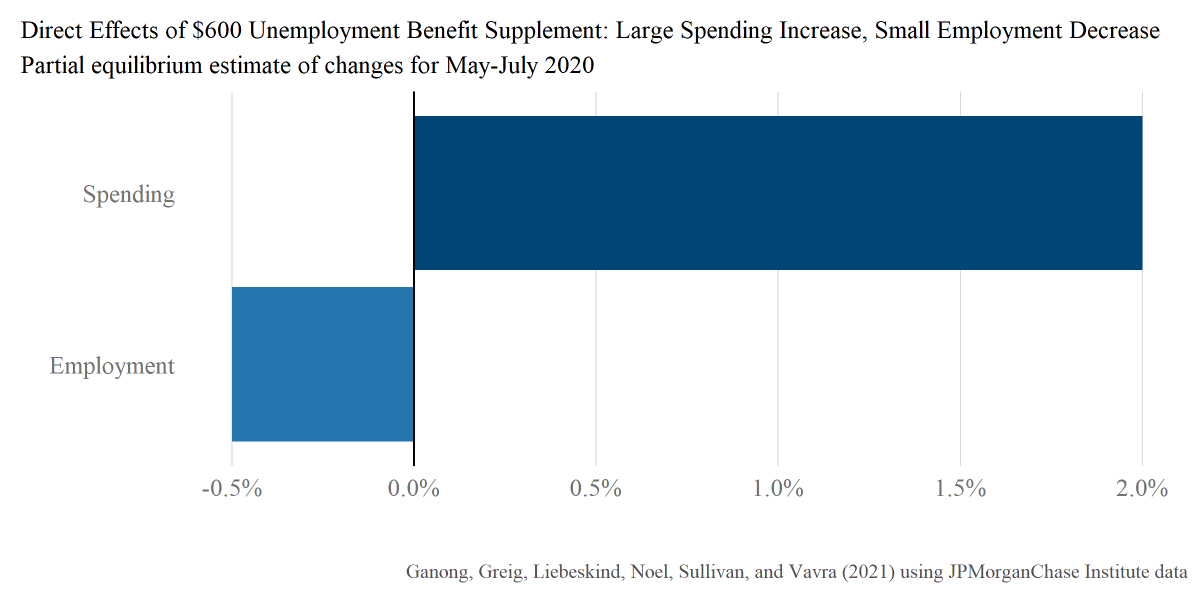
Tldr: spending ⬆️ more than expected,
job search ⬇️ order of magnitude less than expected
1) rise of repeat unemployment
2) effect of UI on spending
3) effect of UI on job search
4) connections to current policy debate
Tldr: spending ⬆️ more than expected,
job search ⬇️ order of magnitude less than expected
1) rise of repeat unemployment
2) effect of UI on spending
3) effect of UI on job search
4) connections to current policy debate
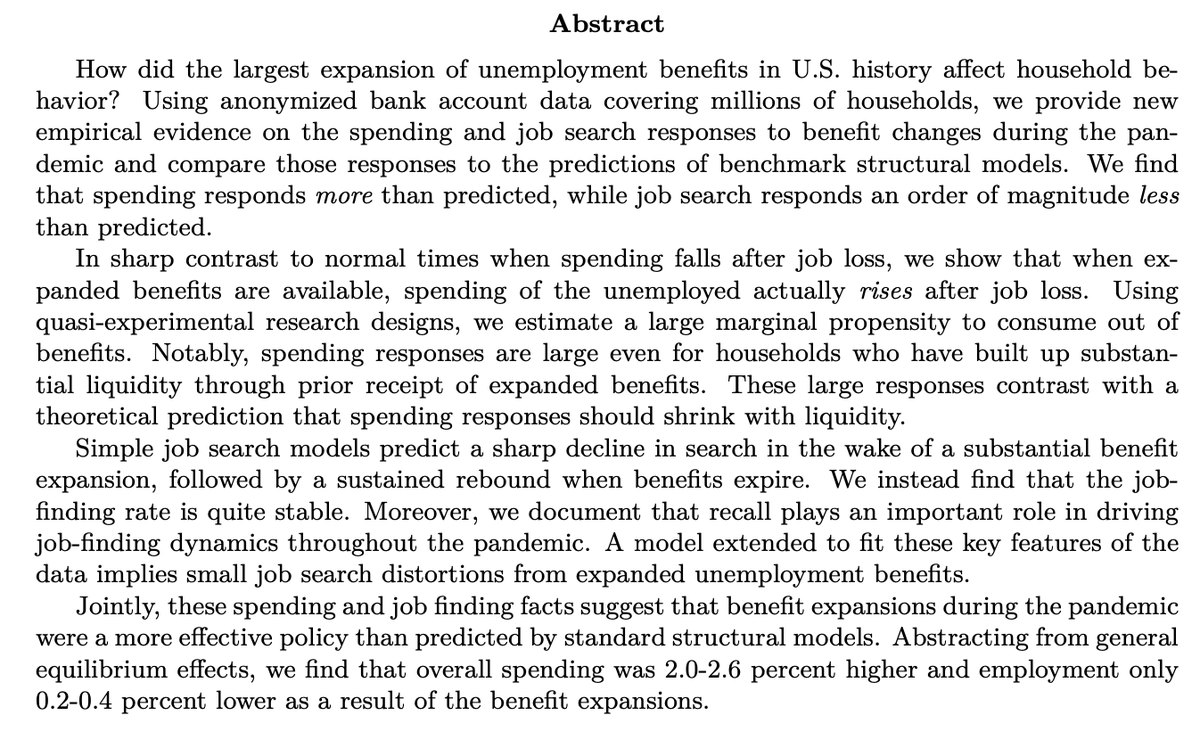
“Spending and Job Search Impacts of Expanded Unemployment Benefits: Evidence from Administrative Micro Data”
With @FionaGreigDC @maxliebeskind @pascaljnoel @Dan_M_Sullivan @JoeVavra
bfi.uchicago.edu/working-paper/…
With @FionaGreigDC @maxliebeskind @pascaljnoel @Dan_M_Sullivan @JoeVavra
bfi.uchicago.edu/working-paper/…
1) we can track workers’ experiences over the course of pandemic
Confirm well-known fact: long-term unemployment is high
New finding: *repeat* unemployment has been rising. (Estimates of long-term unemployment in the CPS miss this since they only ask about most recent spell)
Confirm well-known fact: long-term unemployment is high
New finding: *repeat* unemployment has been rising. (Estimates of long-term unemployment in the CPS miss this since they only ask about most recent spell)

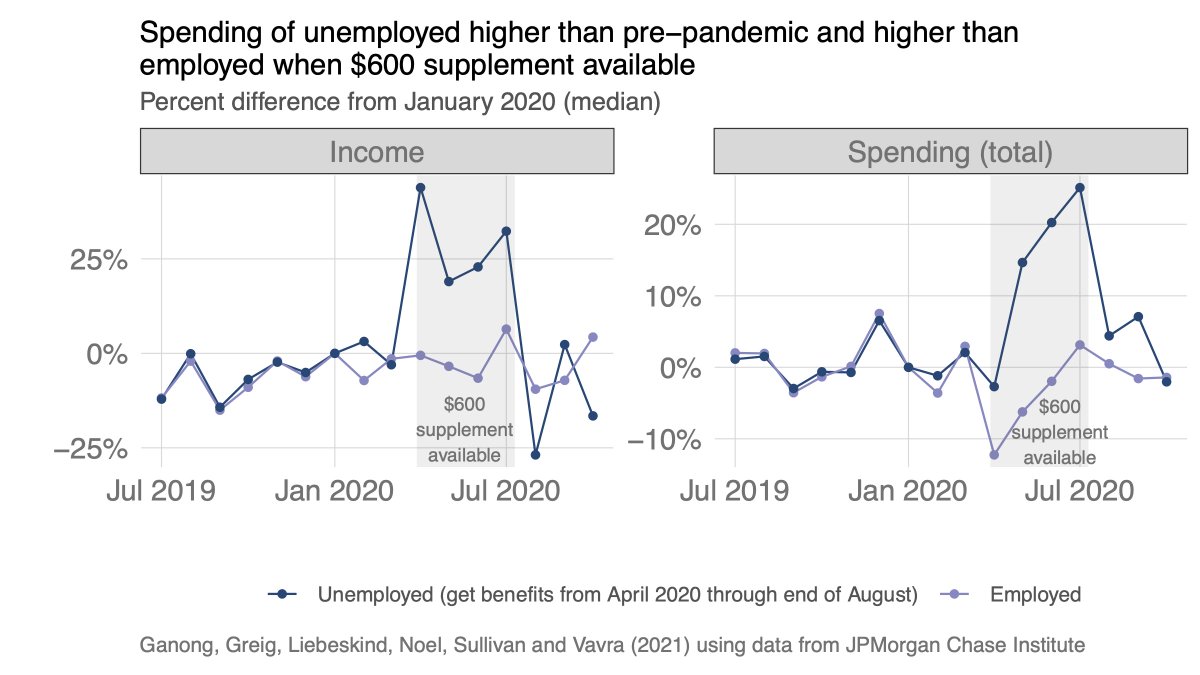
2a) Spending rises and falls with unemployment insurance.
Every other pre-pandemic paper: spending ⬇️ during unemployment.
US during pandemic: spending ⬆️⬆️ during unemployment b/c of the $600 supplement.
Every other pre-pandemic paper: spending ⬇️ during unemployment.
US during pandemic: spending ⬆️⬆️ during unemployment b/c of the $600 supplement.
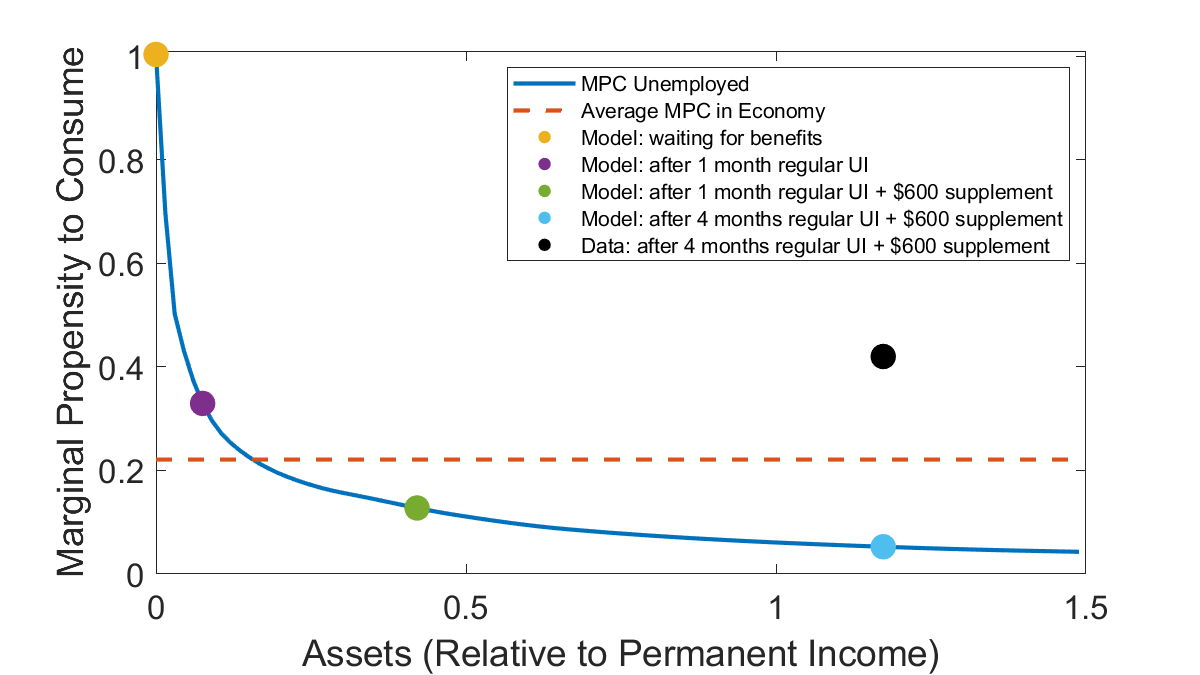
2b) Spending rises more than expected.
Workers used the $600 supplement (available April-July) to build up substantial liquidity and yet we still see high MPCs from the $300 supplement (largely paid out in September).
Workers used the $600 supplement (available April-July) to build up substantial liquidity and yet we still see high MPCs from the $300 supplement (largely paid out in September).
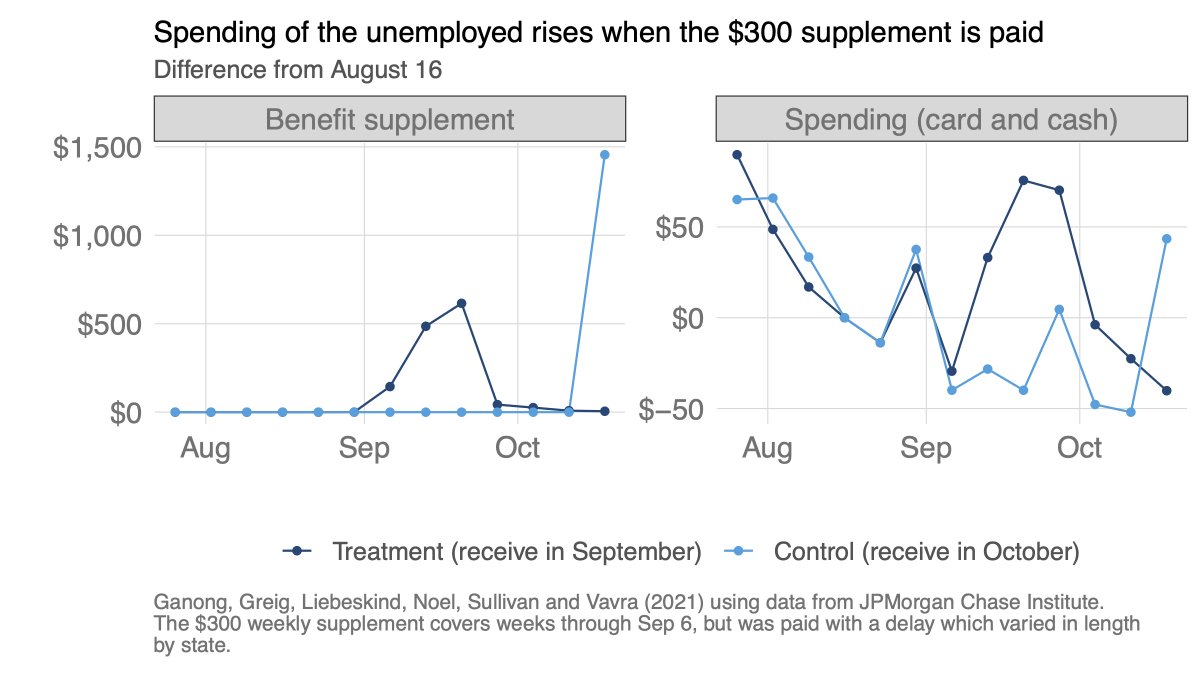
A large spending response to additional UI, even after liquidity built up, is remarkable.
In the standard consumption model, high liquidity => low MPC
Spending out of UI supplements is larger than what the standard model predicts (will return to this in policy thoughts below)
In the standard consumption model, high liquidity => low MPC
Spending out of UI supplements is larger than what the standard model predicts (will return to this in policy thoughts below)
3) In contrast to spending (which changes more than expected), job-finding changes *less* than expected
I wish we had a quasi-experimental design here, but we don’t because every unemployed worker is eligible for the supplement. Instead, we study the evolution of job-finding
I wish we had a quasi-experimental design here, but we don’t because every unemployed worker is eligible for the supplement. Instead, we study the evolution of job-finding
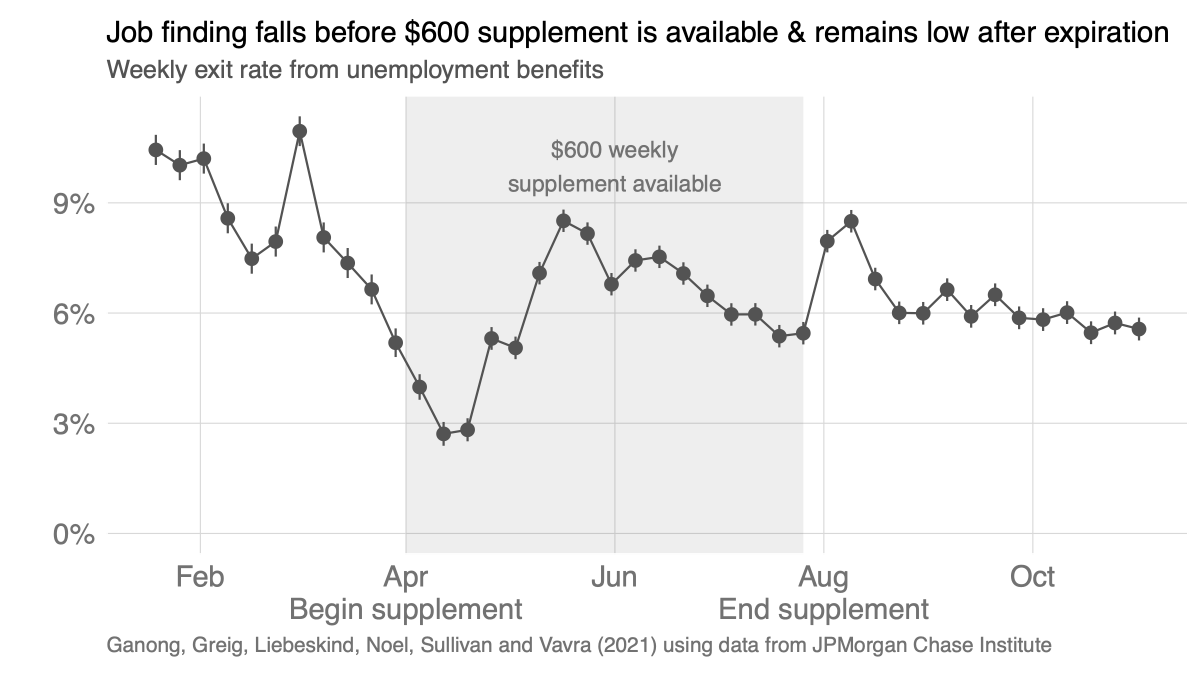
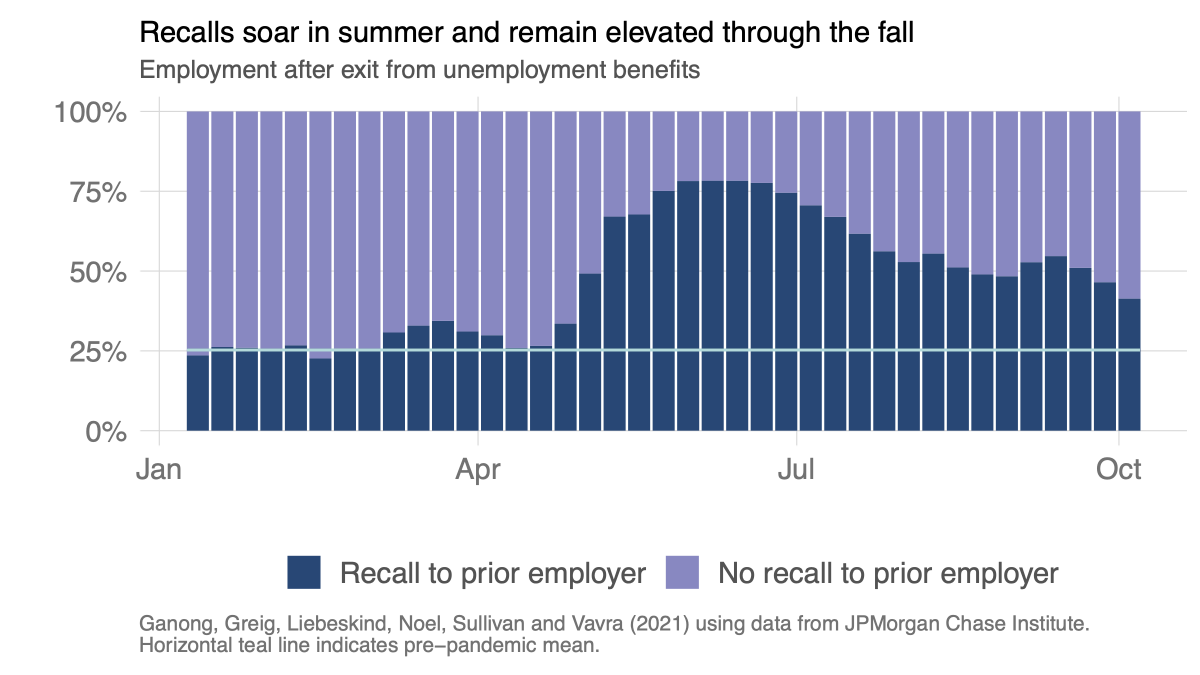
How did so many people go back to work in an obviously depressed economy?
Answer: many people who were laid off and got UI were then recalled to prior employer.
Answer: many people who were laid off and got UI were then recalled to prior employer.
@lkatz42 and Bruce Meyer wrote some of their classic early papers on how recalls affect job search (more on this below). In the pandemic, Boar and @Simon_Mongey's paper explaining why a worker will accept a recall even when UI is high is insightful
bfi.uchicago.edu/insight/findin…
bfi.uchicago.edu/insight/findin…
How much would a $600 supplement affect job search?
Using a standard structural model tied to pre-pandemic estimates of the disincentive effect of UI, a $600 supplement would cause massive fluctuations in job finding.
Data: little change in job finding => disincentive is small
Using a standard structural model tied to pre-pandemic estimates of the disincentive effect of UI, a $600 supplement would cause massive fluctuations in job finding.
Data: little change in job finding => disincentive is small
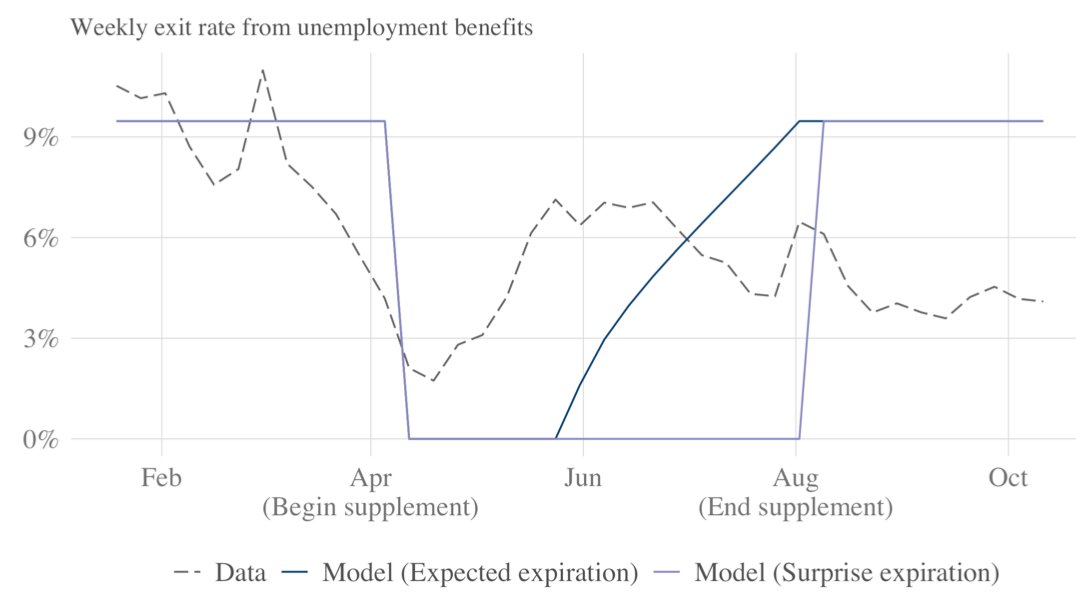
We enrich our model to allow for recalls (this is essentially the @lkatz42 (1986) model). the evolution of new job starts can do a much better job of matching the data from the pandemic. 
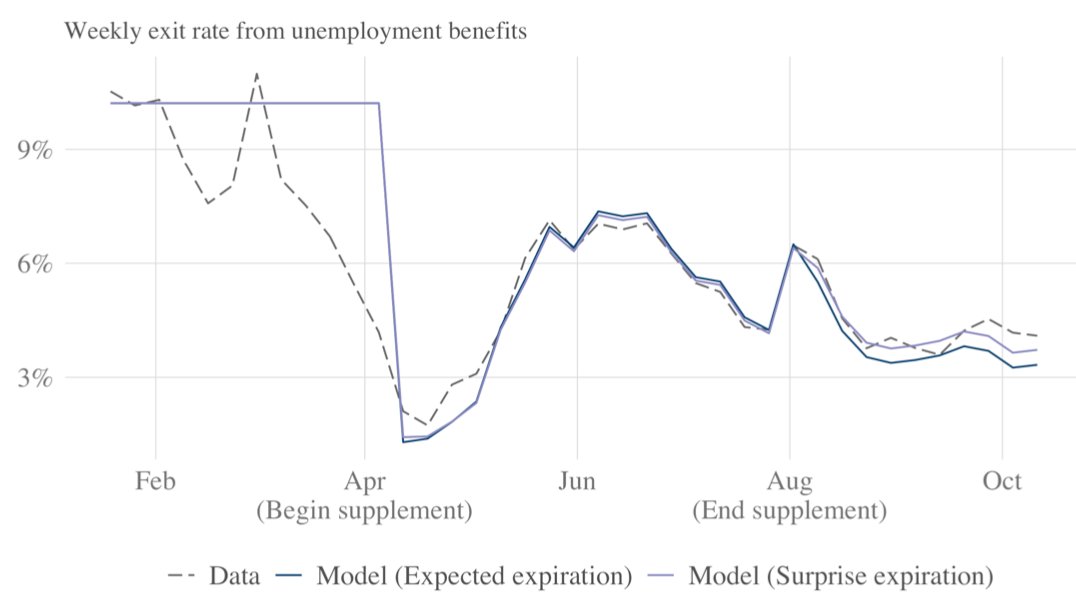
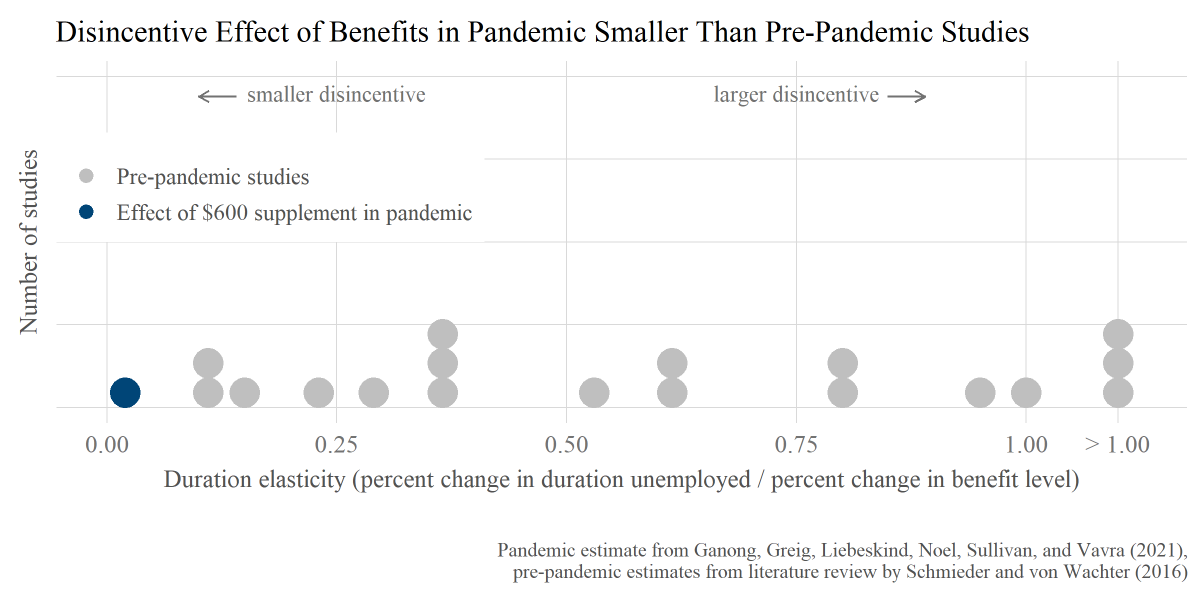
In the enriched model, we estimate a duration elasticity of 0.02.
This is tiny.
To understand how tiny, we compare to pre-pandemic studies from a recent lit review by @JFSchmieder and
@TillvonWachter
This is tiny.
To understand how tiny, we compare to pre-pandemic studies from a recent lit review by @JFSchmieder and
@TillvonWachter
Finding a small duration elasticity is consistent with data from Homebase analyzed by @danascoot @finamor_lucas
lucasfinamor.github.io/files/Finamor_…
I also think @arindube will soon be releasing estimates of the duration elasticity using the Household Pulse survey.
lucasfinamor.github.io/files/Finamor_…
I also think @arindube will soon be releasing estimates of the duration elasticity using the Household Pulse survey.
We combine our causal spending estimates and our model-based job search estimates to quantify the impact of the supplement (abstracting from GE effects). We think the estimates are suggestive that the benefits outweigh the costs, but we don’t analyze that question in this draft. 
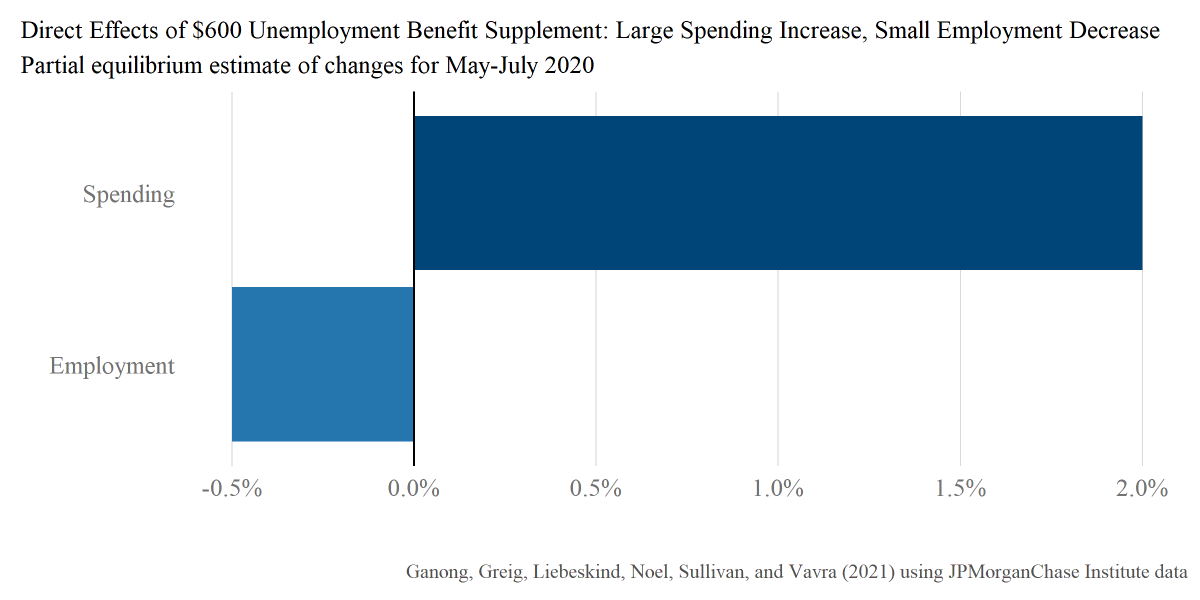
How to compare dSpend and dEmployment?
idea: “What cost per job created is needed for the policy to raise employment on net?”
Lit review by @gchodorowreich: cost per job in last recession was $25K-$125K
If cost per job < $453K (likely true), the $600 supplement ⬆️ employment
idea: “What cost per job created is needed for the policy to raise employment on net?”
Lit review by @gchodorowreich: cost per job in last recession was $25K-$125K
If cost per job < $453K (likely true), the $600 supplement ⬆️ employment
This ends the paper. Sorry the thread is so long! Four thoughts on how our results relate to current discussions about the American Rescue Plan (ARP).
1) There is a crisis of long-term unemployment (known) and repeated unemployment (new to our paper).
Need to help these workers get back on their feet;
ARP expands UI but doesn’t help with wage insurance, subsidized jobs or other ways to bring displaced workers back to work
Need to help these workers get back on their feet;
ARP expands UI but doesn’t help with wage insurance, subsidized jobs or other ways to bring displaced workers back to work
2) We are particularly worried about workers who are waiting for recall.
Among new UI claimants in California, @alexbellecon @TJ_hedin Schnorr & @TillvonWachter, 60% expect recall.
Among all unemployed in CPS, 2.7 million (25% of all unemployed) expect recall
Among new UI claimants in California, @alexbellecon @TJ_hedin Schnorr & @TillvonWachter, 60% expect recall.
Among all unemployed in CPS, 2.7 million (25% of all unemployed) expect recall
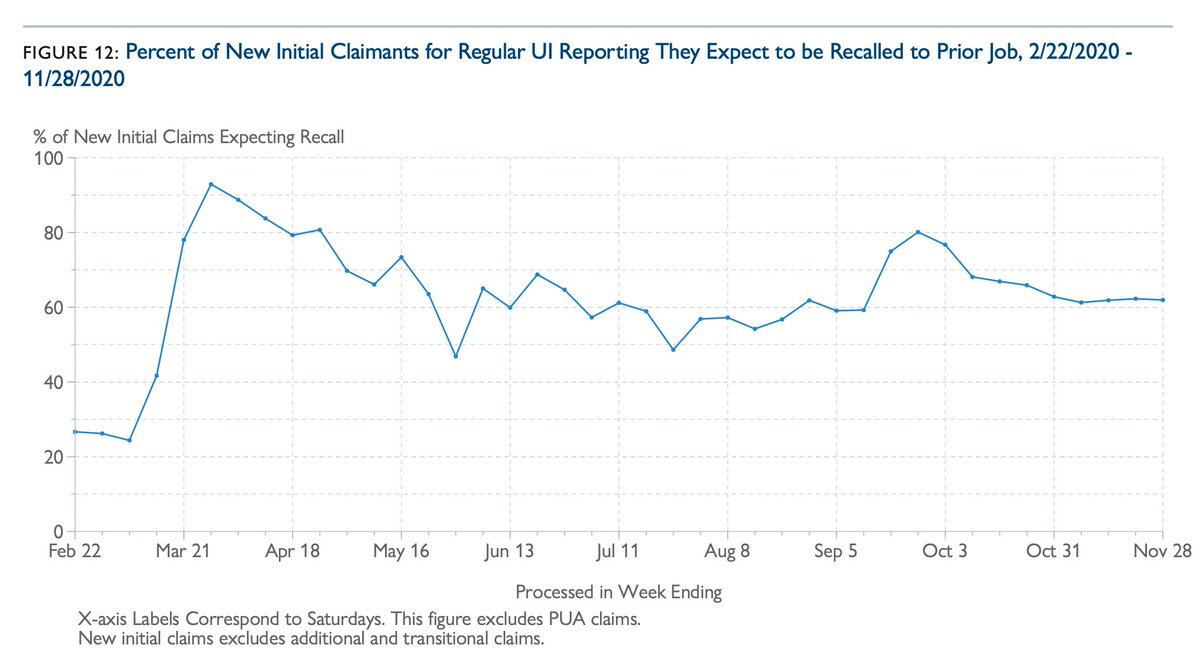
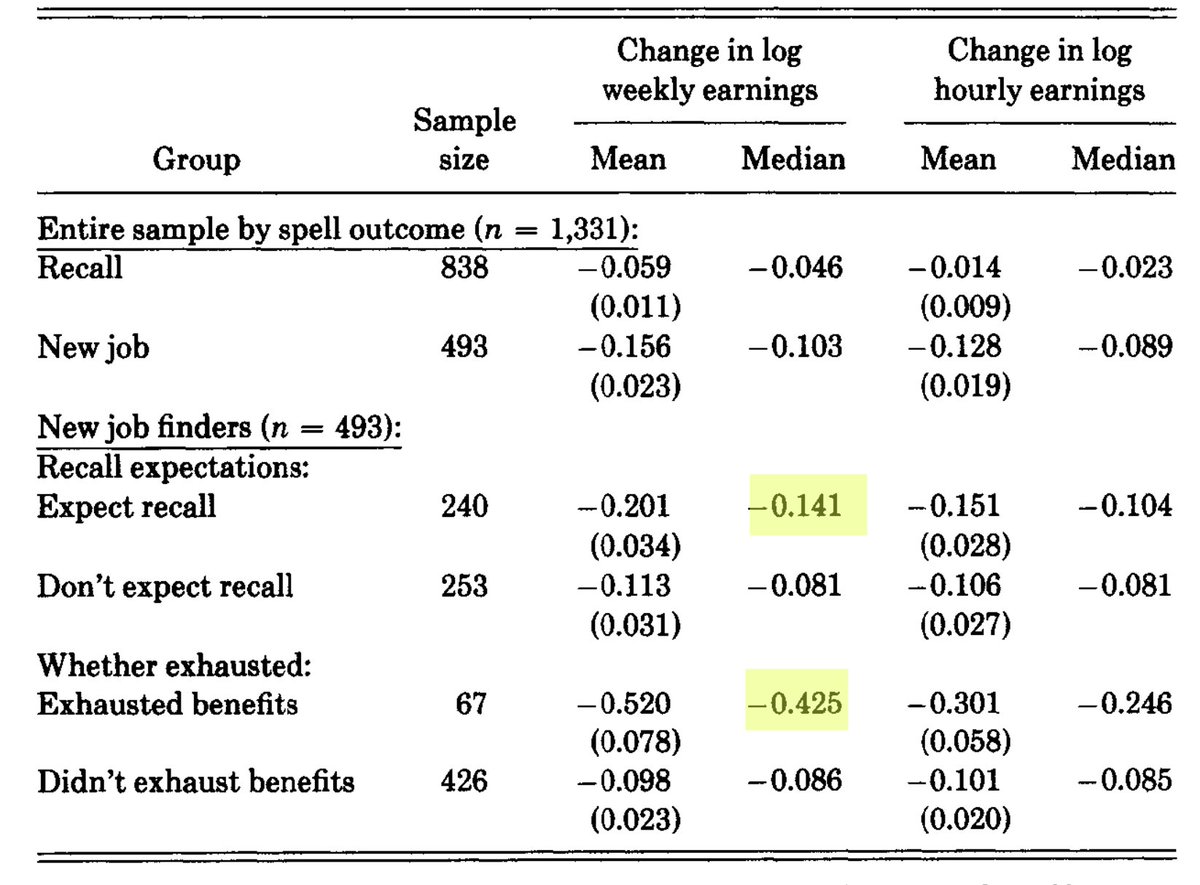
2, cntd) @lkatz42 and Meyer (1990) find that workers who expect to be recalled search less & if not recalled, end up taking much lower-paying jobs
It would be a tragedy if these patterns are repeated en masse from people who lost their jobs in the pandemic & didn’t get recalled
It would be a tragedy if these patterns are repeated en masse from people who lost their jobs in the pandemic & didn’t get recalled
3) Some economists (e.g. @Noahpinion) argue that because savings are high, additional gov’t payments won’t be spent quickly
Our analysis doesn't support this argument b/c for UI, we find a substantial spending response *even when savings are elevated*
Our analysis doesn't support this argument b/c for UI, we find a substantial spending response *even when savings are elevated*
https://twitter.com/guido_lorenzoni/status/1358916696879333376?s=20
4) Our finding of a tiny job search disincentive effect in 2020 hinges crucially on the fact that we estimate job search costs to be very high. High costs reflect two channels: (a) harder to search during a pandemic, (b) not many employers hiring for new positions in a pandemic.
4, ctd) As most people get vaccinated, these channels may no longer hold. If the economy returns to normal in 2021 (we don’t have a crystal ball, but we sure hope it will!), then the disincentive effect of UI supplements will likely be larger than they were in 2020
[end the longest twitter thread I have ever written... and the largest number of people I have ever tagged... there's a lot of great research in this area right now!]
Beyond the tweets above, there's more on policy implications here jpmorganchase.com/content/dam/jp…
• • •
Missing some Tweet in this thread? You can try to
force a refresh


