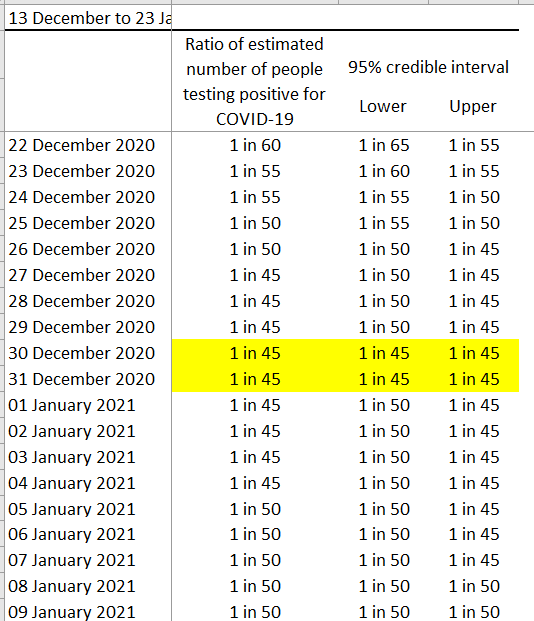
Changes in prevalence will reflect changes in infections about 2 weeks earlier. Take age 2-year 6 group (mainly primary). Estimated prevalence increased until a peak on 24 Dec (implying infections peaked about 10 Dec). So infections started falling at a time schools were open.
Prevalence falls until 6 Jan (i.e. infections about 23 Dec) & then increases again. i.e. infections in primary kids started increasing again when schools were shut for holidays.
Prevalence starts falling again from 18 Jan, i.e. infections falling from about 4 Jan, exactly when lots of primary schools kids were in school.
You might even argue the prevalence data suggests closing schools increases infections but, given possible Christmas effects & uncertainty over the incidence-prevalence lag, that would be a stretch.
As for HE moving online. In-person teaching had finished by 9 Dec, but most stopped a week or so earlier. So any effect on prevalence in yr 12-age 24 group should be evident well before Christmas. In fact ONS has peak for that group on 30 Dec.
The ONS modelled age estimates have quite wide confidence intervals so we should be cautious with using them to make inferences. But these data certainly don't seem to me to be telling us that tells us that school closure/moving HE online reduces infections.
As for hospitality, in most of the country it was shut for most of the (if not the whole) period including when infections were going up as well as down, so not sure the prevalence data really tell us that closing pubs reduces infections either.
• • •
Missing some Tweet in this thread? You can try to
force a refresh
1. When there is a surge in infections, cases eventually come down whether or not there is a lockdown/significant restrictions. 2. Lockdowns/many restrictions have little (not necessarily no) impact on hospitalisations & deaths.
Some find this hard to accept, as it seems so obvious:
Transmission comes from contact, restrictions reduce contact, so surely restrictions must reduce transmission & hence admissions & deaths?
But there are lots of reasons why restrictions may have less benefit than expected:
1. People change their behaviour voluntarily in response to changes in infections.
You choose to take less risk when infections surge, more risk when infections low, but just as importantly ...
Restrictions were imposed to stop health services being overwhelmed.
Govt policy on reopening now seems to be based on an assumption that opening 1 thing inevitably increases transmission & so something else has to be kept shut.
There is little support for this in the data ...
E.g. A number of academic papers suggest opening schools has little or no impact on transmission rates:
One reason I am sceptical about impact of Tier 3&4 is decline in infections from end-Dec is part of the normal longer run trend we see v. often: when cases rise, rate of growth increases, then declines & eventually goes negative. A bit like R declining but still > 1 for a while.
Here is rate of growth for Zoe estimates for England.
Growth rate turns -ve (i.e. estimated infections start to fall) on data from 3 Jan (implying infections falling perhaps 5-6 days earlier). But growth rate started falling from 16 Dec, i.e. before school hols or Tier 4.
V. little sign of tier changes/lockdown accelerating the trend. In fact, the inflection point around 23-28th Dec happens just when effect of school holidays/T3 then T4 in London/SE/E might have kicked in. Similarly, no sign of any accelerating of trend after lockdown.
This is an interesting response by @cjsnowdon to @toadmeister but many of the examples he cites do not support his argument that infections start falling after lockdowns.
Here’s a closer look at 3 of them: France (31st Oct), Ireland (24th-31st Dec) & England (5th Nov)
1. France: 7-day cases were falling from 3rd Nov (not the 8th as @cjsnowdon states), positivity from 2nd, hospitalisations from the 5th. Given lag, these all show infections falling well before 31st October ...
France's estimated R-rate started falling from 24 Oct & there is no indication lockdown accelerated the decrease.
The 31st October French lockdown is not a good example of lockdown effectiveness.
A self-proclaimed fact checking website run by a Conservative MP & Govt policy advisor still states “Cases were not falling before the January 2021 lockdown”. They refer to 3 pieces of evidence ...
Weekly data obscures the daily peak but even so, PHE surveillance show peak was in wk 53 (28 Dec-3 Jan), i.e. pre-national lockdown, consistent with the daily data. assets.publishing.service.gov.uk/government/upl…
2. "ONS infection survey ... rose to 1 in 50 by Jan 2 2021":
they don’t clarify this is prevalence (total currently infected) which will peak much later than incidence (new infections). As it happens, ONS daily estimates suggest even prevalence peaked pre-lockdown.