DJ @ITRADE191 multiple chart analysis for INTRADAY TRADING.
1. Core setup
2. Pivot points trades
3. PDH/PDL trades
4. Open interest addictions combined with rejections on charts.
5. Website to confirm bias
Very quick read.
Share if you liked for the benefit of everyone.
1. Core setup
2. Pivot points trades
3. PDH/PDL trades
4. Open interest addictions combined with rejections on charts.
5. Website to confirm bias
Very quick read.
Share if you liked for the benefit of everyone.
•Main setup of @ITRADE191
He used this setup daily for all trades.
1. EMA crossover 10/20
2. Supertrend 10/3
3. Vwap
4. RSI > 60
He used this setup daily for all trades.
1. EMA crossover 10/20
2. Supertrend 10/3
3. Vwap
4. RSI > 60
https://twitter.com/ITRADE191/status/1271735626329493505?s=19
•Closing above pivots so he took a quick scalp and made +21k immediately.
https://twitter.com/ITRADE191/status/1318504351954956288?s=19
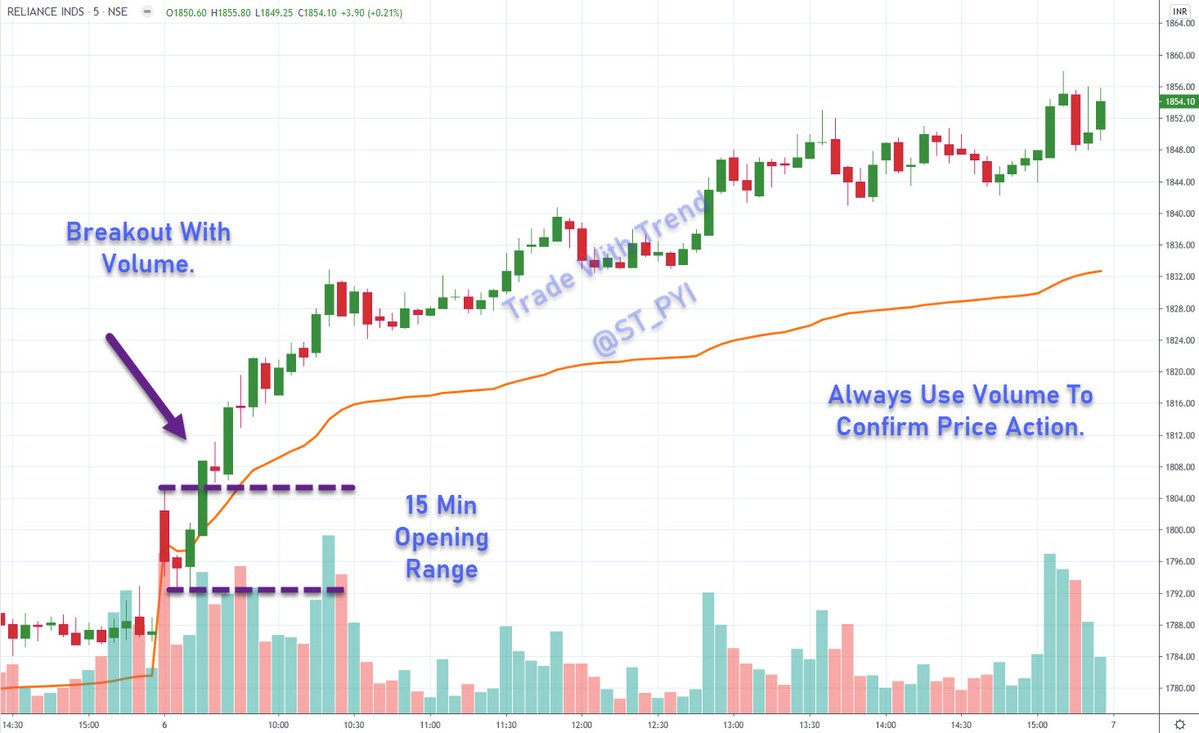
•Reliance trade
1. Rsi above 60
2. Higher volumes
3. Above EMA/Vwap
1. Rsi above 60
2. Higher volumes
3. Above EMA/Vwap
https://twitter.com/ITRADE191/status/1295569576814493700?s=19
•Another chart of Reliance, crossing previous high with volumes
https://twitter.com/ITRADE191/status/1313840027651043330?s=19
•If you see Huge OI, look for a rebound from that OI strike.
https://twitter.com/ITRADE191/status/1315921670792642564?s=19
•Another example of resistance when Open Interest added is huge.
1. Huge Calls OI added
2. Rejection from that strike level.
1. Huge Calls OI added
2. Rejection from that strike level.
https://twitter.com/ITRADE191/status/1317017320015814657?s=19
• One more example of huge OI on call side added but then huge buying volumes come and sustains above the strike level so call sellers trapped.
Check the second tweet as well in this.
Check the second tweet as well in this.
https://twitter.com/ITRADE191/status/1313340859438440449?s=19
Good buying opportunity
1. 13800 PE huge OI added
2. Market tested day low and rejected from there.
1. 13800 PE huge OI added
2. Market tested day low and rejected from there.
https://twitter.com/ITRADE191/status/1354683586041974784?s=19
Three rejections where huge OI added, big downfall comes.
Check the second tweet inside this tweet.
Check the second tweet inside this tweet.
https://twitter.com/ITRADE191/status/1314158516664320002?s=19
Another example of buying above a big red candle high near resistance and trailing.
https://twitter.com/ITRADE191/status/1341681503273553921?s=19
Niftyindices.Com website giving him further confidence to look for buying trades.
https://twitter.com/ITRADE191/status/1339134617069125633?s=19
Pdh was Resistance for a long time.
Down fall from PDH and took support PDL or always book profit near these levels.
Down fall from PDH and took support PDL or always book profit near these levels.
https://twitter.com/ITRADE191/status/1352190587349336065?s=19
Thread on how he made 3 lakh intraday profit through such logics in two days.
https://twitter.com/AdityaTodmal/status/1331958164363698176?s=19
Practice via these charts and logics and become consistent like him so that you can make profit daily.
Observe rejections at Pivots/PDH/PDL combined with OI analysis to improve consistency.
The END
___________________________________
Observe rejections at Pivots/PDH/PDL combined with OI analysis to improve consistency.
The END
___________________________________
• • •
Missing some Tweet in this thread? You can try to
force a refresh