The latest round of federal aid is hitting the economy: Big bounceback in retail sales last month (+5.3%) after three straight monthly declines.
census.gov/retail/marts/w…
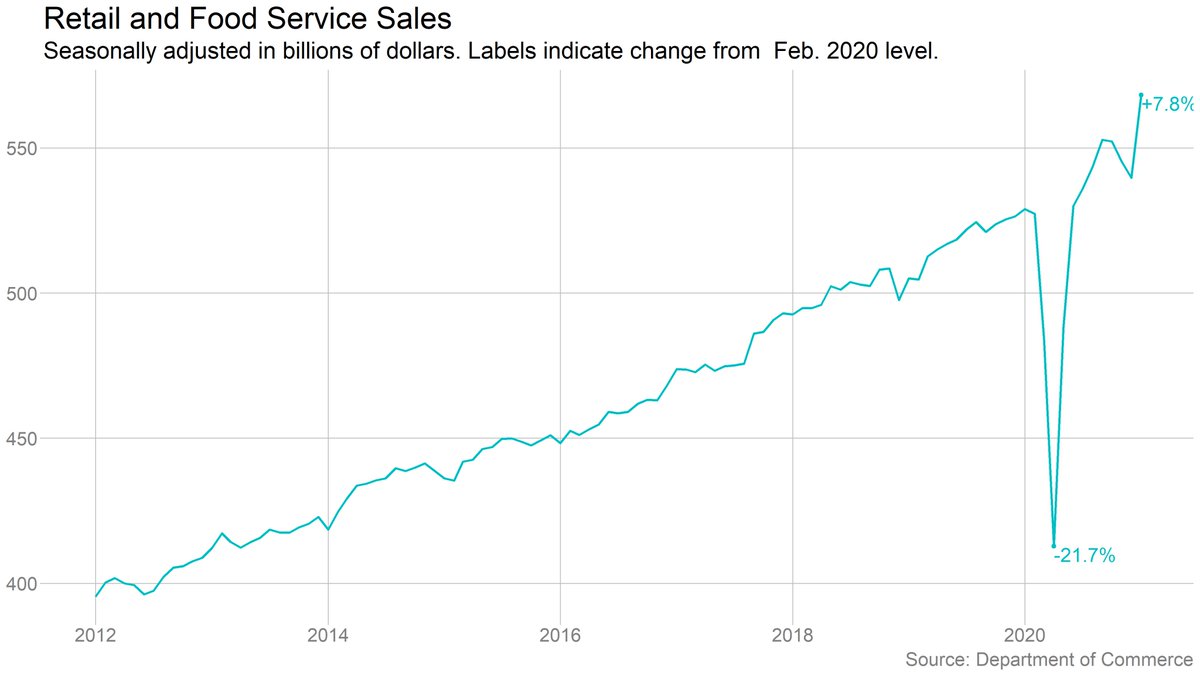
Retail sales (incl. food services) are now up nearly 8% from pre-pandemic levels. Amazing rebound from the more than 20% decline last spring.
Picture looks very different for restaurants/bars. They saw a jump in January too, but are still way behind where they were before the pandemic, and haven't fully made up for the ground lost in the fall/winter.
The aggregate trends in retail sales obscure some truly bonkers shifts beneath the surface. Grocery-store sales spiked last spring and remain elevated. Online sales surged and are still edging up. Clothing-store sales cratered and are still depressed.
It's always good to view December/January retail sales data with a bit of caution because of big seasonal issues. But it's very hard not to look at the big Nov/Dec drops and the even bigger Jan gain and see the effects of a) the virus, and b) government aid.

• • •

Missing some Tweet in this thread? You can try to force a refresh
 

Keep Current with Ben Casselman

Ben Casselman Profile picture

Stay in touch and get notified when new unrolls are available from this author!

Read all threads

This Thread may be Removed Anytime!

PDF

Twitter may remove this content at anytime! Save it as PDF for later use!

Try unrolling a thread yourself!

how to unroll video
  1. Follow @ThreadReaderApp to mention us!

  2. From a Twitter thread mention us with a keyword "unroll"
@threadreaderapp unroll

Practice here first or read more on our help page!

More from @bencasselman

5 Feb
The U.S. economy added 49,000 jobs in January, a modest rebound from December's decline but still a much slower pace of growth than over the summer.
The unemployment rate fell to 6.3%.
nytimes.com/live/2021/02/0…
Revisions make December's decline look worse, now down 227k jobs. November also revised down.
We're still down nearly 10 million jobs from the pre-pandemic peak, and we gained essentially no jobs in January. We're barely even climbing out of the hole right ow.
Read 7 tweets
4 Feb
The kiddo decided to start taking random photos around the house and turn them into grunge-era album covers.
So your mission is... name the band/album. Image
This one is definitely catching that Windows 95 vibe. Image
Getting into collage. Image
Read 4 tweets
15 Jan
Given the renewed attention on the possibility of a $15 federal minimum wage, it's worth noting that "$15/hour" looks very different in 2021 than it did when the "Fight for $15" movement began in 2012. (Thread)
Obviously, there's been some inflation. $15 in 2012 is the equivalent of around $17 today. But that's only a small part of it. At least before the pandemic, wages were rising faster than inflation, *especially for low earners.*
In 2012, a quarter of jobs were in places where the median wage was under $15/hour (meaning more than half of all workers in those places would have been owed raises). In 2019, less than 5% of jobs were in such places.
Read 17 tweets
15 Jan
Retail sales fell for the third straight month in December -- clear sign the resurgent pandemic is taking a toll.
Important to note, though, that unlike with most measures of the economy, retail sales are actually ABOVE their prepandemic level. Up 2.6% from February, and 2.9% over the past year. So not a clean story like with jobs.
Very different story with restaurants, of course. They were down much more in December (-4.5%), and are down more than 20% since before the pandemic.
Read 4 tweets
14 Jan
Big spike in unemployment claims last week: 1.2 million people filed for unemployment benefits (regular state programs, not seasonally adjusted). Another 284k filed for Pandemic Unemployment Assistance.
nytimes.com/live/2021/01/1…
Important to note that the big jump may reflect a bounceback after the holidays, when filings are often depressed. But this level is extraordinarily high by any measure.
Seasonally adjusted claims also jumped, to just under 1 million.
Read 7 tweets
2 Jan
A year ago, I did a thread on my efforts to diversify my source list. I tracked the race and gender of my sources again this year. In the interest of accountability, here's an update on my progress.

Here's my original thread for reference:
Topline findings: Roughly half of my 400+ sources this year were women, including a hair over half of the people I quoted as experts (and just under half of the people I quoted as "regular people" -- workers, business owners, etc.).
(Note: I also have a category for elected officials, spokespeople, etc. They're included in the totals here but not broken out separately.)
Read 24 tweets

Did Thread Reader help you today?

Support us! We are indie developers!


This site is made by just two indie developers on a laptop doing marketing, support and development! Read more about the story.

Become a Premium Member ($3/month or $30/year) and get exclusive features!

Become Premium

Too expensive? Make a small donation by buying us coffee ($5) or help with server cost ($10)

Donate via Paypal Become our Patreon

Thank you for your support!

Follow Us on Twitter!