IMPORTANT EDUCATIONAL THREAD. 1/n
A quick thread on implied volatility and cash-secured puts for newbie traders and new options traders.
First, implied volatility is the anticipation of how much the price is "expected" to move. Most times, IV < realized volatility. Important!
A quick thread on implied volatility and cash-secured puts for newbie traders and new options traders.
First, implied volatility is the anticipation of how much the price is "expected" to move. Most times, IV < realized volatility. Important!
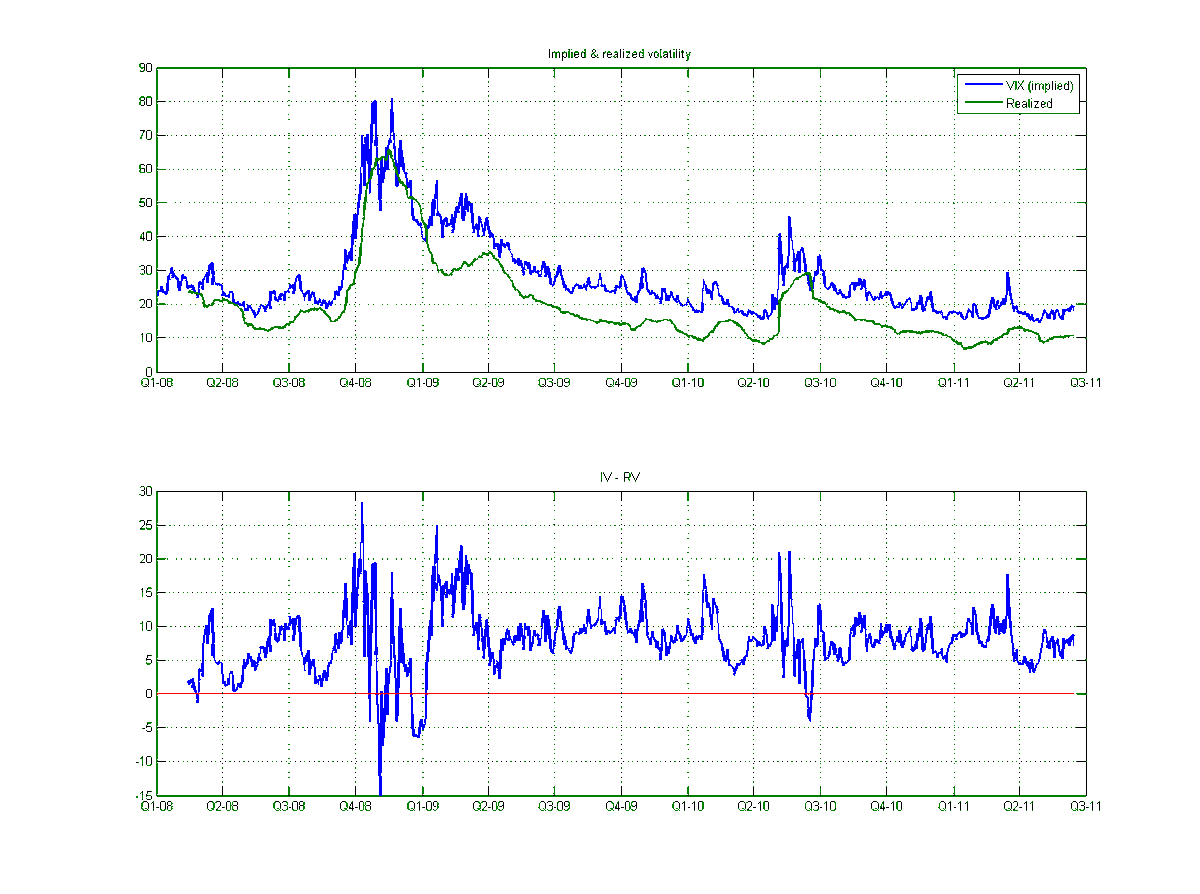
2/n Why do we care if IV is mostly less than realized volatility. I'll explain.
But first, you also need to know about another loose property of IV. When it gets too high, it mean reverts. What the hell does that mean? Look at $MARA historical IV.
But first, you also need to know about another loose property of IV. When it gets too high, it mean reverts. What the hell does that mean? Look at $MARA historical IV.

** 1/n It's IV > Realized volatility. Sorry, this is important to get right. Stupid me!
3/n Mean reversion is a very loose property of IV but it's there and we can use it. Let's take a look at other examples.
Attached examples of $AMC $PLTR and $FUBO. See how when they all went up high, they reverted back to a stable region (mean).
Attached examples of $AMC $PLTR and $FUBO. See how when they all went up high, they reverted back to a stable region (mean).


4/n How do we measure this mean reversion. Well, there's a thing called IV Rank or IV Percentile that tells you how high the current IV is relative to its historical value. Mostly, anything between 60-80% percentile is high and mean reverting.
> 80% sometimes gets risky!
> 80% sometimes gets risky!
5/n Where do I find IV rank? You'll soon be able to find it on Tradytics but for right now, you'll have to use your brokerage as most provide this value.
Let us now assume that we have a stock with very high iv rank and we know it's gonna mean revert.
Let us now assume that we have a stock with very high iv rank and we know it's gonna mean revert.
6/n Let us also assume that we really like that stock but it's overextended. We'd like to have it. Anything we can do? Absolutely.
Since IV is very high, we can go far out of the money and sell a put option. For instance, $MARA is about 40 right now.
Since IV is very high, we can go far out of the money and sell a put option. For instance, $MARA is about 40 right now.
7/n We can sell a $MARA put options for 13 Strike, June 2021, for about 150 bucks. That's a good amount and we keep it.
If $MARA touches or goes below 13, we'll have to buy 100 shares at 13 which is totally okay with us because we like the stock. Winning here right?
If $MARA touches or goes below 13, we'll have to buy 100 shares at 13 which is totally okay with us because we like the stock. Winning here right?
8/n The above part is understood by many. What's not understood is that you don't really have to wait till June to see what happens. Remember, IV is mean reverting.
A quick lesson first, high IV makes the contract prices higher. Low IV decreases the price.
A quick lesson first, high IV makes the contract prices higher. Low IV decreases the price.
9/n Finally the sauce here. Since IV is high and we just sold a put for 150 bucks, very soon, IV is going to decrease and mean revert which means the price of that 150 bucks PUT contract is going decrease a lot. That's exactly what you want. You want the contract price to go to 0
10/n It won't really go to zero because there are other factors/greeks involved like theta, delta etc. But just a decrease in IV is going to reduce the contract price significantly.
Let's say IV decreases and the contract goes from $150 to $40.
Let's say IV decreases and the contract goes from $150 to $40.
11/n What you can do is just close out your position for a $90 profit here. Closing out means buying the put back for 40 bucks.
How did we win here? Let me now summarize.
How did we win here? Let me now summarize.
12/n
1. If price goes below 13 by June, you'll just get 100 $MARA shares at $13/share. That's a very good price right? Remember, it's at about 40 right now. You're getting it dirt cheap. You'll have to pay 1300 - 150 = 1150 dollars. Remember, you got 150 in premiums!
1. If price goes below 13 by June, you'll just get 100 $MARA shares at $13/share. That's a very good price right? Remember, it's at about 40 right now. You're getting it dirt cheap. You'll have to pay 1300 - 150 = 1150 dollars. Remember, you got 150 in premiums!
13/n
2. If price starts to consolidate, the IV is going to reduce and your contract is going to decrease in value which is again a win for us because we can close it and keep our profits.
3. If price keeps going up, the value of PUT will also decrease because it's a PUT!!
2. If price starts to consolidate, the IV is going to reduce and your contract is going to decrease in value which is again a win for us because we can close it and keep our profits.
3. If price keeps going up, the value of PUT will also decrease because it's a PUT!!
14/n
But this has to fail somewhere, right? Yes. It fails when the price goes below your sold contract's strike price by a lot. What happens if $MARA goes to $5 tomorrow? You lose big. But as long as you pick solid stocks, this is less likely.
But this has to fail somewhere, right? Yes. It fails when the price goes below your sold contract's strike price by a lot. What happens if $MARA goes to $5 tomorrow? You lose big. But as long as you pick solid stocks, this is less likely.
15/n That's the rant. It's all jumbled up but hopefully you'll be able to understand the crux of it.
TLDR: Selling cash secured puts on very high IV stocks with solid companies behind them is a good way to generate income.
TLDR: Selling cash secured puts on very high IV stocks with solid companies behind them is a good way to generate income.
That's it. Thank you for reading this. Happy to answer any questions.
• • •
Missing some Tweet in this thread? You can try to
force a refresh