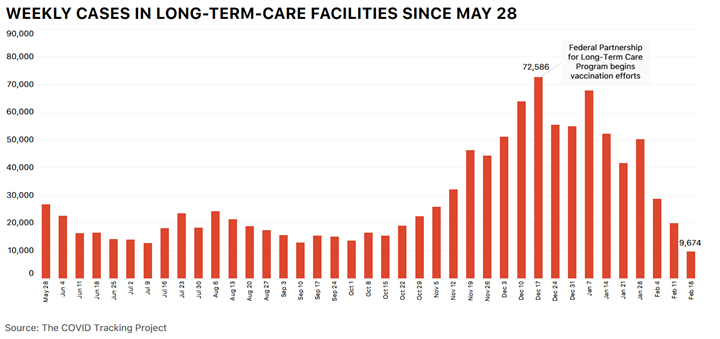
Our daily update is published. States reported 1.3M tests, 72k cases, 58,222 people currently hospitalized, and 2,074 deaths. 4 bar charts showing key COVID-19 metrics for the US over ti
Today's COVID-19 case count is the lowest on a Saturday since Oct 17. Chart showing daily COVID-19 cases on a Saturday since March
Hospitalizations continue to drop. Today's total is the lowest since Nov 8. Chart showing hospitalizations due to COVID-19 going back to
While there are encouraging trends in declining COVID-19 cases, hospitalizations, and deaths, the 7-day average for COVID-19 tests is moving in the wrong direction. Tests are down 16.7% from last week. Four charts showing the weekly tests, cases, average hospita
Data from TX is still a bit wobbly. Total PCR tests (specimens) decreased by 85k without explanation, after increasing by over 400k yesterday.

• • •

Missing some Tweet in this thread? You can try to force a refresh
 

Keep Current with The COVID Tracking Project

The COVID Tracking Project Profile picture

Stay in touch and get notified when new unrolls are available from this author!

Read all threads

This Thread may be Removed Anytime!

PDF

Twitter may remove this content at anytime! Save it as PDF for later use!

Try unrolling a thread yourself!

how to unroll video
  1. Follow @ThreadReaderApp to mention us!

  2. From a Twitter thread mention us with a keyword "unroll"
@threadreaderapp unroll

Practice here first or read more on our help page!

More from @COVID19Tracking

22 Feb
Since vaccinations began in late 2020, we expected them to show up first in our Long-Term-Care data. And it finally has. We’ve seen signs over the last few weeks that vaccines, along with a broader decrease in community spread, are having a rapid, positive impact in LTCs. Alt-text: 3 bar charts show...
Deaths in LTCs have fallen drastically. After adjusting for backlogs, our weekly deaths figure has declined ~70% since Jan 7. LTCs previously accounted for at least 35% of total deaths, yet last week their share was cut to 16%, the lowest ever recorded in our dataset. Alt-Text: bar chart showing...
Since their peak just before Christmas, new cases in long-term-care facilities have fallen by 87%, with the bulk of the drop occurring in the last three weeks. New cases last week were the lowest ever recorded in our dataset, which dates back to May 28. Alt-Text: Cases in long-ter...
Read 6 tweets
20 Feb
Our daily update is published. States reported 1.9M tests, 75k cases, 59,882 people currently hospitalized, and 2,477 deaths. 4 bar charts showing key COVID-19 metrics for the US over ti
COVID-19 hospitalizations are now under 60k for the first time since November 9, bringing us back down to the peak levels of hospitalizations we saw in the spring and summer surges. A chart showing hospitalizations due to COVID-19 going back
Hospitalizations are still dropping quickly in every region of the country. 4 charts showing hospitalizations due to COVID-19 for each U
Read 5 tweets
19 Feb
Our daily update is published. States reported 1.4M tests, 67k cases, 62,300 currently hospitalized, and 2,616 deaths. Alt-Text: 4 bar charts with key COVID-19 for the US. States
7-day average deaths fell below 2,000 for the first time since Dec 4. This deaths average was above 3,000 as recently as Feb 6. Alt-Text: bar chart showing daily deaths from COVID-19 in th
Data users may notice differences in 7-day average deaths between our social posts and website. We have removed major death backlogs reported by OH and IN in these daily social posts to clarify the trend. Those backlogs remain in our cumulative numbers.
Read 4 tweets
18 Feb
Our weekly update is published. All major indicators of COVID-19 transmission in the US continue to fall rapidly. Deaths are down 20% from last week. covidtracking.com/analysis-updat… 4 bar charts showing weekly COVID-19 metrics for the US. Tes
Although states are still reporting large numbers of cases, many parts of the country show absolute levels much closer to what we saw before the most recent surge accelerated nationally in October. 2 cartograms of the US, both showing COVID-19 cases by state
Every region and sub-region of the US now shows substantial declines in the number of hospitalized COVID-19 patients. 9 area charts showing currently hospitalized by US sub-regio
Read 6 tweets
18 Feb
Our daily update is published. States reported 1.3 million tests, 66k cases, 63,398 people currently hospitalized with COVID-19, and 2,336 deaths. 4 bar charts showing key COVID-19 metrics for the US over ti
Weather-related outages in Texas have resulted in significant case and fatality reporting delays. It's likely that winter storms across the country have partially resulted in artificially low numbers.
5 weeks ago, 33 states reported 500 or more COVID-19 cases per million people. Today, no states have reached that threshold. Cartogram of US state showing the number of COVID-19 cases pCartogram of US state showing the number of COVID-19 cases p
Read 4 tweets
17 Feb
As we’ve shared, The COVID Tracking Project will be winding down data compilation on Mar 7. Before then, we’re taking a close look at federal data sources. Today we’re sharing the first installment in a series of analyses on federal testing data: covidtracking.com/analysis-updat…
Federal testing data has made great strides since our first look at it in May. It’s become more standardized and more detailed—you can now download historical state data and 7-day county-level data from the HHS. healthdata.gov/search/og_grou…
But for all those improvements, it still doesn’t line up to state data. Even accounting for definitional differences, 25 states show notable differences between state and federal testing totals: Cartogram of US states showing the difference between CTP an
Read 6 tweets

Did Thread Reader help you today?

Support us! We are indie developers!


This site is made by just two indie developers on a laptop doing marketing, support and development! Read more about the story.

Become a Premium Member ($3/month or $30/year) and get exclusive features!

Become Premium

Too expensive? Make a small donation by buying us coffee ($5) or help with server cost ($10)

Donate via Paypal Become our Patreon

Thank you for your support!

Follow Us on Twitter!