I propose naming this approach the Jeffit estimator.
"We used Jeffit to estimate the average partial effects and their .95 CIs."

"We compare our main results with those obtained using Jeffit."
Here's a Stata do-file for –jeffit– (just a tweaked version of the poisson.ado sourcecode).

No guarantees/warranties.

uwmadison.box.com/s/q8y8029qtqjh…
A next step would be to replace some/all of the –poisson– goodness-of-fit statistics with ones that might be more relevant for nonlinear conditional-mean estimation.
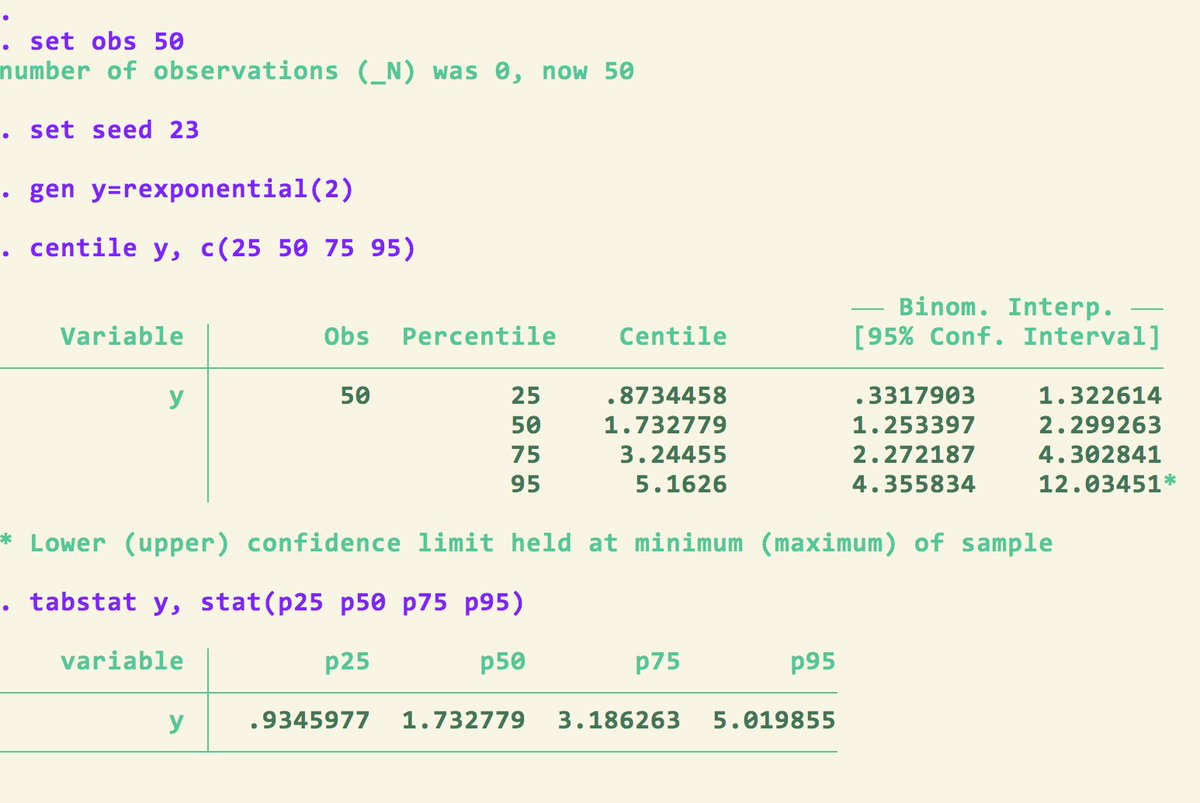
And of course I should have specified vce(robust)
E.g. (w/ apologies to Chris and Bill)...

• • •

Missing some Tweet in this thread? You can try to force a refresh
 

Keep Current with John Mullahy

John Mullahy Profile picture

Stay in touch and get notified when new unrolls are available from this author!

Read all threads

This Thread may be Removed Anytime!

PDF

Twitter may remove this content at anytime! Save it as PDF for later use!

Try unrolling a thread yourself!

how to unroll video
  1. Follow @ThreadReaderApp to mention us!

  2. From a Twitter thread mention us with a keyword "unroll"
@threadreaderapp unroll

Practice here first or read more on our help page!

More from @JohnMullahy

23 Feb
In light of yesterday's massive thread on Poisson regression I thought it perhaps appropriate to revisit an issue that arises sometimes with Poisson estimation in Stata.

This will be familiar to some of you but perhaps not to others.
The typical case is where there are ≥1 dummy RHS variables that are almost always 0 (or almost always 1).
The Poisson estimator requires solving the vector of equations x'(y-exp(x*b))=0. This solution requires in turn that none of the dummy x's can equal 1 *only* when y=0. Else x'y=0 and the algorithm is trying to find a value of b that makes exp(x*b)=0 which can't happen.
Read 11 tweets
27 May 20
If you use @Stata to compute/estimate quantiles/percentiles there's a Statalist thread that may be of interest. (Spoiler: Different commands can yield different results—except for the median—so exercise care with tail-probability, IQR, etc. calculations.)
statalist.org/forums/forum/g…
This is probably a negligible concern when analyzing most "large" samples, but not necessarily so for "small" ones.
Here's an example—
Read 5 tweets
11 May 20
Earlier threads have considered the use of the –recast– option in @Stata graphics. Here's another.
The –twoway function– command in Stata permits nice visualizations of explicit functions y=f(x) over some continuous domain of x-values. E.g.

twoway function y=normal(x), range(-3 3)
This can be helpful in...

— visualizing comparative features of different explicit functions

— visualizing theoretical vs. empirical results (e.g. goodness-of-fit)

— etc.
Read 9 tweets

Did Thread Reader help you today?

Support us! We are indie developers!


This site is made by just two indie developers on a laptop doing marketing, support and development! Read more about the story.

Become a Premium Member ($3/month or $30/year) and get exclusive features!

Become Premium

Too expensive? Make a small donation by buying us coffee ($5) or help with server cost ($10)

Donate via Paypal Become our Patreon

Thank you for your support!

Follow Us on Twitter!