In light of yesterday's massive thread on Poisson regression I thought it perhaps appropriate to revisit an issue that arises sometimes with Poisson estimation in Stata.
This will be familiar to some of you but perhaps not to others.
This will be familiar to some of you but perhaps not to others.
The typical case is where there are ≥1 dummy RHS variables that are almost always 0 (or almost always 1).
The Poisson estimator requires solving the vector of equations x'(y-exp(x*b))=0. This solution requires in turn that none of the dummy x's can equal 1 *only* when y=0. Else x'y=0 and the algorithm is trying to find a value of b that makes exp(x*b)=0 which can't happen.
The problem is that Stata's –poisson– and –glm– algorithms will, at least sometimes, not detect this data structure and will cosmetically appear to have converged to a solution.
Typically the magnitude of one or more parameter estimates will be huge and this is the tip-off.
Typically the magnitude of one or more parameter estimates will be huge and this is the tip-off.
Consider this dataset where x2'y=0. 

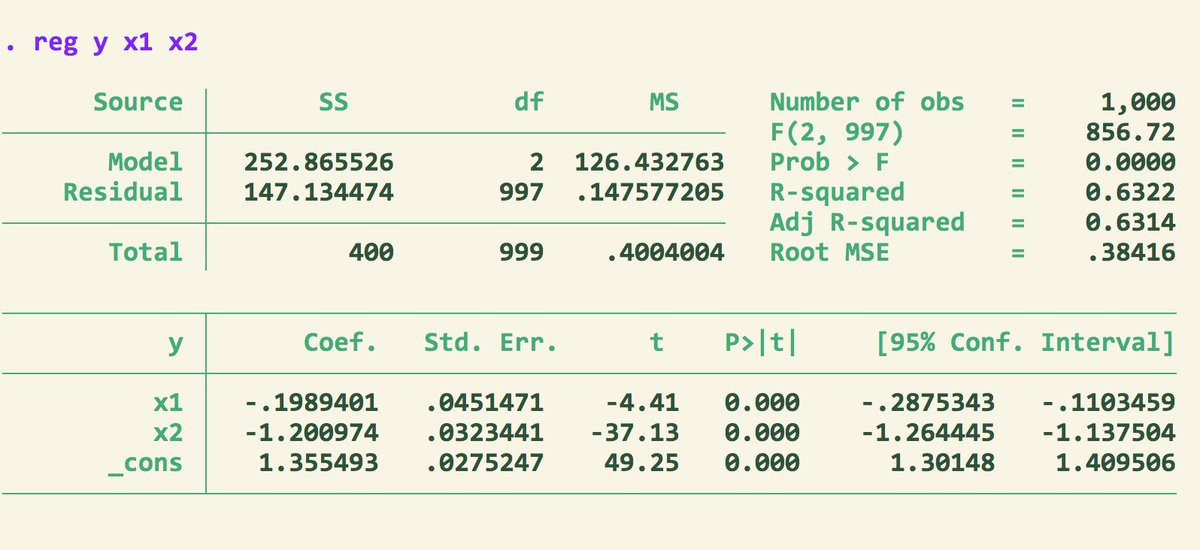
Here are the results from poisson regression. Note the estimated parameter for x2.

This isn't just a small-sample artifact...

The glm procedure has the same problem...

Note that a linear model does not encounter this problem because its conditional mean is not restricted to be positive.
The solution is easy and obvious: Before undertaking Poisson estimation check your estimation sample to be sure it doesn't have these features. (Note: The same dummy-variable "spanning" problems arise with binary outcomes and probit, logit, etc.)
@threadreaderapp unroll
Postscript: Joao Santos Silva (who is not on Twitter to my knowledge) posted this earlier today on StataList, with a link to his nice paper (also linked yesterday in this thread by @AustnNchols) and a strong endorsement of –ppmlhdfe–
statalist.org/forums/forum/g…
statalist.org/forums/forum/g…


• • •
Missing some Tweet in this thread? You can try to
force a refresh