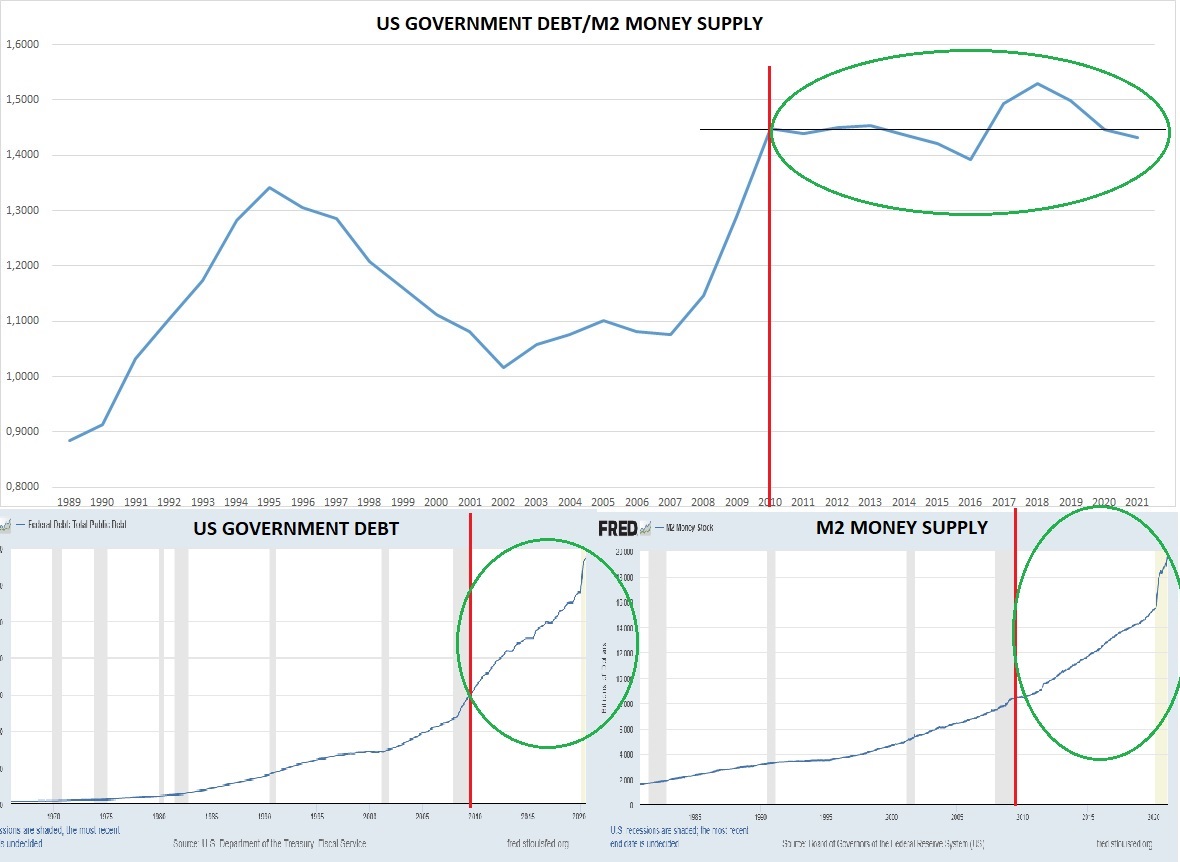
thread1-2008 broke the trendline, this means that money supply increase faster and higher than gdp can grow. You can also see brown line entering in a down patern with lower highs. this is because money isnt going to real economy but going to bonds and stocks and other spec. as. 

thread2-If FED is injecting 100 usd to get 100 usd or less growth in gdp, it means that economy is not getting real growth is a zero sum game, thats why you can see the decouple of the brown line since 2008, meaning new printed dollars doesnt make a real growth in usd terms
Thread3- here u can see that money printing is getting parabolic while gdp is rising in a constant trend, showing that you need more dollars to get the same constant growth. 

thread4-the same pattern with debt, you need more units of dollars debts to keep growing at the same trend. So you have more money supply and more debt in the economy to keep the same growth trendline 

Thread5- if rates are so low because fed keeps monetizing debt, means that nobody will lend to USA, so if u cant refinance debt and get dollars to keep boosting gdp, means that you will need more printing. So in the future will see a hiperparabola in mone supply
Thread6- Try to think how bad would have looked m2 if they couldn't have sold all that debt since 2008. well i think we are gonna see it in this crisis.
7-Peolpe say BITCOIN is a ponzi scheeme, i say the world is a ponzi. USA and China, BOTH need every year more debt to growth less each year, soon the expansion periods will be with negative returns in USA, u ll be in an expansive economy with negative growth, welcome to ARGENTINA 

BLUE M2 ORANGE BTCusd, first time in btc history m2 soars like this, orange will meet blue at 500k per btc 

(ornge)BTC usd / m2, is like velocity of money but for btc, meaning that even with m2 soaring is not big enough to make the trend go downs, because btc price rice faster than m2 supply,but gold(blue)gold/m2,the increase of m2 is higher than the apreciation of gold trending down 

FINALLY, just see this video will show you how blind we are in this PONZI economy.
PS: the same apply for almost all the economies in the world under the FIAT system, they just cant stand the music from stopping, if growth stops the system collapse
PS: the same apply for almost all the economies in the world under the FIAT system, they just cant stand the music from stopping, if growth stops the system collapse
• • •
Missing some Tweet in this thread? You can try to
force a refresh


